Ethereum is posting modest daily losses near $380 on Saturday. ETH/USD could gather bullish momentum with a daily close above $400. Ethereum (ETH/USD) climbed higher toward $400 on Thursday but lost its traction and closed in the negative territory on Friday. On Saturday, the modest bearish pressure on ETH/USD remains intact and the pair was last seen losing 1.45% on a daily basis at $380. Ethereum technical outlook 
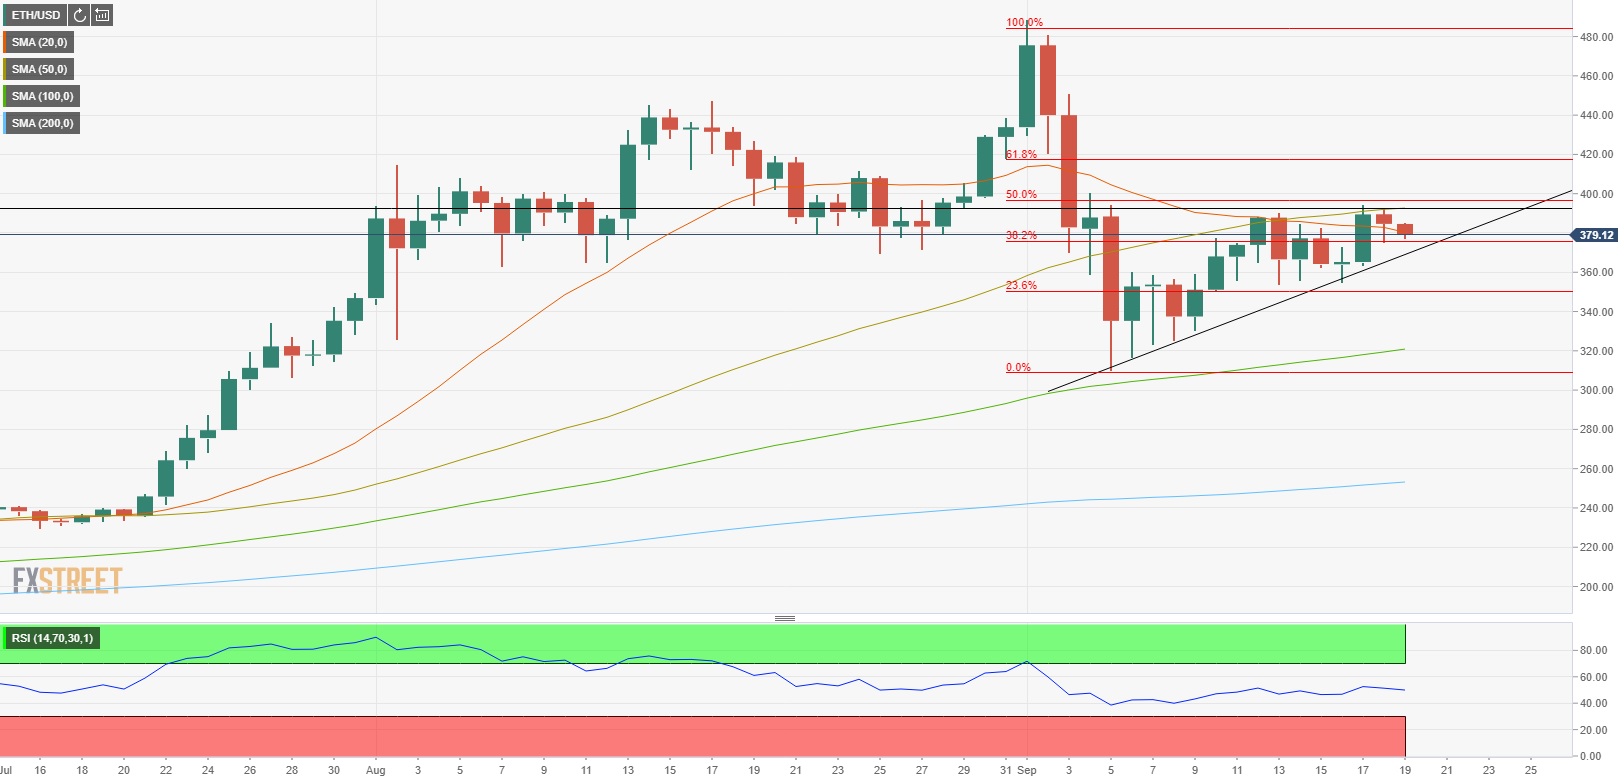
An ascending triangle seems to have formed on Ethereum’s daily chart. This formation is usually considered to be a bullish pattern when it’s seen within an active uptrend. Although this is not the case, the resistance line of the triangle seems to be coinciding with 50% Fibonacci retracement of early-September drop and the 50-day SMA, suggesting a break above that level could open the door for additional gains. $420 (Fibonacci 61.8% retracement) could be seen as the next target. On the downside, the initial support aligns at $375 (Fibonacci 38.2% retracement/ascending line of the triangle). If Ethereum retreats to this area and confirms it as a support, it’s likely to retest $400 in the near-term. Below $375 the next support could be seen at $350 (Fibonacci 23.6% retracement). ETH/USD daily chart FX Street FX Street FXStreet is the leading independent portal dedicated to the Foreign Exchange (Forex) market. It was launched in 2000 and the portal has always been proud of their unyielding commitment to provide objective and unbiased information, to enable their users to take better and more confident decisions. View All Post By FX Street Crypto News share Read Next Gold Price Analysis: XAU/USD could extend downward correction below $1,925 FX Street 2 years Ethereum is posting modest daily losses near $380 on Saturday. ETH/USD could gather bullish momentum with a daily close above $400. Ethereum (ETH/USD) climbed higher toward $400 on Thursday but lost its traction and closed in the negative territory on Friday. On Saturday, the modest bearish pressure on ETH/USD remains intact and the pair was last seen losing 1.45% on a daily basis at $380. Ethereum technical outlook An ascending triangle seems to have formed on Ethereum's daily chart. This formation is usually considered to be a bullish pattern when it's seen within an active uptrend. Although this is not the… Regulated Forex Brokers All Brokers Sponsored Brokers Broker Benefits Min Deposit Score Visit Broker 1 $100T&Cs Apply 0% Commission and No stamp DutyRegulated by US,UK & International StockCopy Successfull Traders 9.8 Visit Site FreeBets Reviews$100Your capital is at risk. 2 T&Cs Apply 9.8 Visit Site FreeBets Reviews$100Your capital is at risk. 3 Recommended Broker $100T&Cs Apply No deposit or withdrawal feesTrade major forex pairs such as EUR/USD with leverage up to 30:1 and tight spreads of 0.9 pips Low $100 minimum deposit to open a trading account 9 Visit Site FreeBets ReviewsYour capital is at risk. 4 T&Cs Apply Visit Site FreeBets ReviewsYour capital is at risk. 5 Recommended Broker $0T&Cs Apply Trade gold, silver, and platinum directly against major currenciesUp to 1:500 leverage for forex trading24/5 customer service by phone and email 9 Visit Site FreeBets ReviewsYour capital is at risk.