- ETH/USD is trading for $166.60 as markets opened this Thursday.
- Technical analysis shows increasing bearish momentum.
ETH/USD has had a bullish opening this Thursday as the price went up slightly from $166 to $166.60. ETH/USD had a bearish breakout this Wednesday, as the bulls failed at the $170 mark and price shot down from $170 to $166. In the process, the market crept below the SMA 20 curve. The closest resistance level liest at $170, while the nearest support level is at $165.
ETH/USD Daily Chart
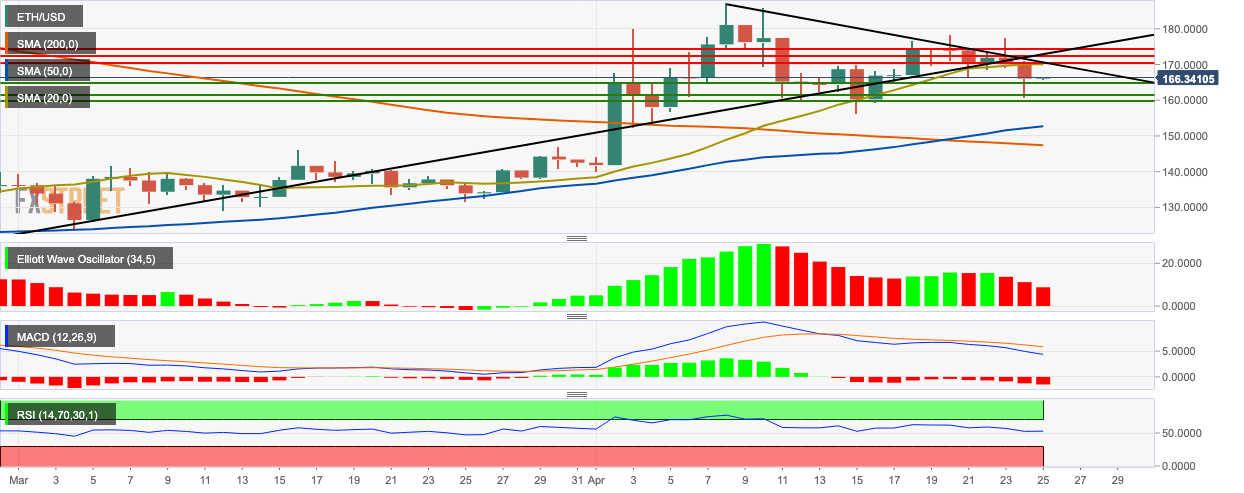
- The market is trending above the SMA 200 and SMA 50 curves while it is below the SMA 20 curve.
- The market had a bearish breakout from the triangle formation.
- Four out of the last five sessions in the Elliot wave oscillator are bearish.
- The signal line is diverging away from the MACD line showing increasing bearish momentum.
- The relative strength index (RSI) indicator is trending in the neutral zone.
