- ETH/USD recovery capped by $160.00 barrier.
- Critical support is created by 61.8% Fibo retracement.
Ethereum (ETH) has recovered from Sunday’s low registered at $156.53 to trade at $159.15 handle at the time of writing. However, despite some positive momentum, the coin is unchanged from this time on Sunday and immovable since the beginning of the Asian trading on Monday.
Ethereum’s technical picture
ETH/USD recovery is now limited by psychological $160.00 coupled with 50.0% Fibo retracement ($159.80). Once this barrier is out of the way, the upside momentum might gain traction with the next focus on $161.70 barrier created by an upper boundary of 1-hour Bollinger Band. This resistance is followed by SMA200 (1-hour) $61.70. The critical barrier is seen at the congestion zone $166.30-50 that encompasses 38.2% Fibo retracement and the upper boundary of the previous consolidation channel.
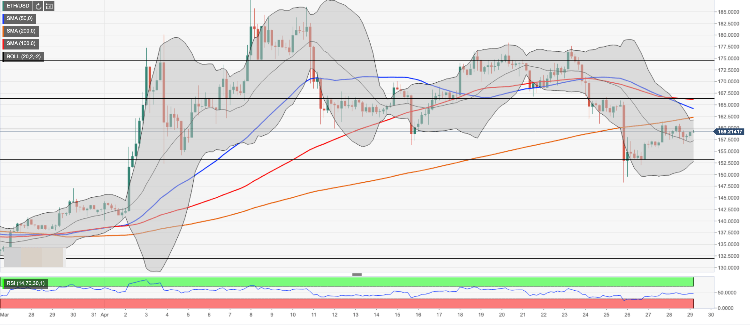
On the downside, a sustainable move under $157.30 (middle line of 4-hour Bollinger Band) will expose $153.00 strengthened by the lower line of 4-hour Bollinger Band and 61.8% Fibo retracement. The next support comes at the recent low of $148.23.
ETH/USD, 4-hour chart