- Ethereum bears are threatening reversal to $200 after bulls failed to clear the resistance at $220.
- ETH/USD is still in the hand of the buyers in spite of the retreat from Monday highs to the short term support at $210.
Ethereum price recently broke out of a descending channel resistance in a bid to push further the recovery started after the nosedive to $175 support in May. The bullish momentum was particularly forceful especially when it came to penetrating the seller congestion at the 50 SMA and the 100 SMA in the 4-hour range. The price action extended above the critical $200 level but fizzled out short of $220.
An intraday high has been reached at $214.86 on Tuesday (lower than Monday’s high above $216). This shows that sellers are getting more confident and could continue to gain more traction against the bulls in the short term.
Meanwhile, the price is teetering 1.86% lower on the day. It has a market value of $210.24 amid a bullish biased trend and high volatility. Looking at the MACD, Ether is still primed for more gains towards $220 as long as the short term support at $210 holds. The indicator is settling into a sideways trend in the positive region. Besides, a minor bullish divergence suggests that buyers have the upper hand. However, the RSI is pointing south as a warning to the bulls to up their game or else risk testing the crucial $200 level.
ETH/USD 4-hour chart
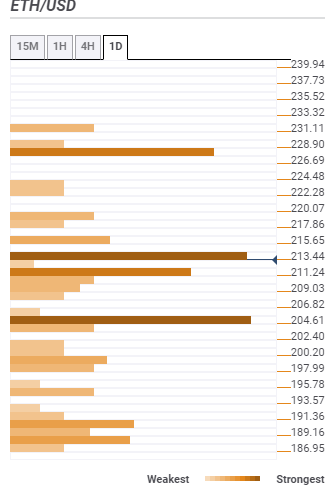
Ethereum confluence resistance and support
Resistance one: $213.44 – Is home to the previous low 4-hour, the Bollinger Band 1-hour middle curve, the Fibonacci 38.2% one-day and the SMA 100 15-minutes.
Resistance two: $228.90 – Highlighted by the previous month high, the pivot point one-week resistance two and pivot point one-day resistance one.
Support one: $211.24 – This zone converges the Bollinger Band one-hour lower, the Fibonacci 61.8% one-day and the SMA ten 4-hour.
Support two: $204.61 – Is the zone where the SMA five one-day, the Fibo 23.6% one-month and the BB one-day middle curve meet.
%20(4)-637254523636281283.png)

