- ETH bears engineered a strong sell-off below the critical support area.
- The downside momentum remains strong at this stage.
Ethereum, now the second-largest digital asset with the current market value of $19.3 billion, has recovered from the recent low of $174.62, though it is still 3.5% lower from this time on Monday. At the time of writing, ETH/USD is changing hands at $176.57.
Ethereum’s technical picture
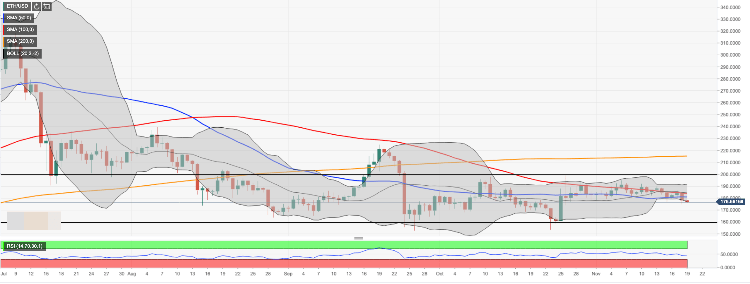
On the daily charts, ETH/USD has moved below SMA50 (Simple Moving Average) at $180.90 and smashed psychological $180.00 and attempted a breakthrough below the lower line of the daily Bollinger Band at $177.23. The bulls lost the initiative and now the risks are skewed to the downside. If $174.00 gives way, the sell-off may be extended towards $160.00, which is the lower boundary of the recent long-term range.
On the upside, keep an eye on the above-said resistance area created by SMA50 daily. It is followed by SMA100 daily on approach to $181.00. We will need to see a sustainable move above this handle for the upside to gain traction.
ETH/USD, the daily chart