- ETH/USD bears snatched up the initiative and pushed the price well below $300.
- Strong support is created by a confluence of technical indicators at $250.
Ethereum, the second largest cryptocurrency with the current market capitalization of $30.4 billion, is in deep decline, down over 10% in recent 24 hours and over 4% since the beginning of the day. At the time of writing, ETH/USD is changing hands at $282.00 amid strong downside momentum.
A lack of follow through after a breakout above $300.00 discouraged ETH bulls, while a sustainable move below $300 handle has worsened the short-term technical picture
Ethereum’s technical picture
The initial support created by a confluence of the lower line of 1-day Bollinger Band and SMA50 (Simple Moving Average) on a daily chart at $276 was broken, which increased the downside pressure and pushed the coin below the next hurdle at $273.50 (the lower line of 1-hour Bollinger Band). The price has entered uncharted territory with the next strong barrier as low as $250.00
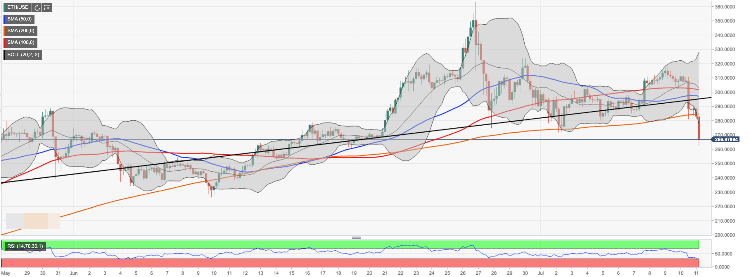
On the upside, the local resistance is created by the previous recovery high at $290.00. Once it is cleared, the upside is likely to gain traction with the next focus on psychological $300 strengthened by a confluence of technical indicators including SMA100 and SMA50 (1-hour), SMA100 4-hour and the middle line of 4-hour Bollinger Band. A sustainable move above this area will open up the way towards the next bullish aim of $310 and $323 (the upper edge of the 4-hour Bollinger Band)
ETH/USD, 1-hour chart