- ETH/USD is range-bound with a bearish bias on the intraday level.
- The strong resistance is located above the current price.
Ethereum is changing hands at $224.15 with a short-term bearish bias amid expanding volatility. Ethereum (ETH) is the second-largest digital asset with the current market value of $24 billion. While barely changed on a day-to-day basis, ETH/USD has lost 1.45% since the beginning of Saturday.
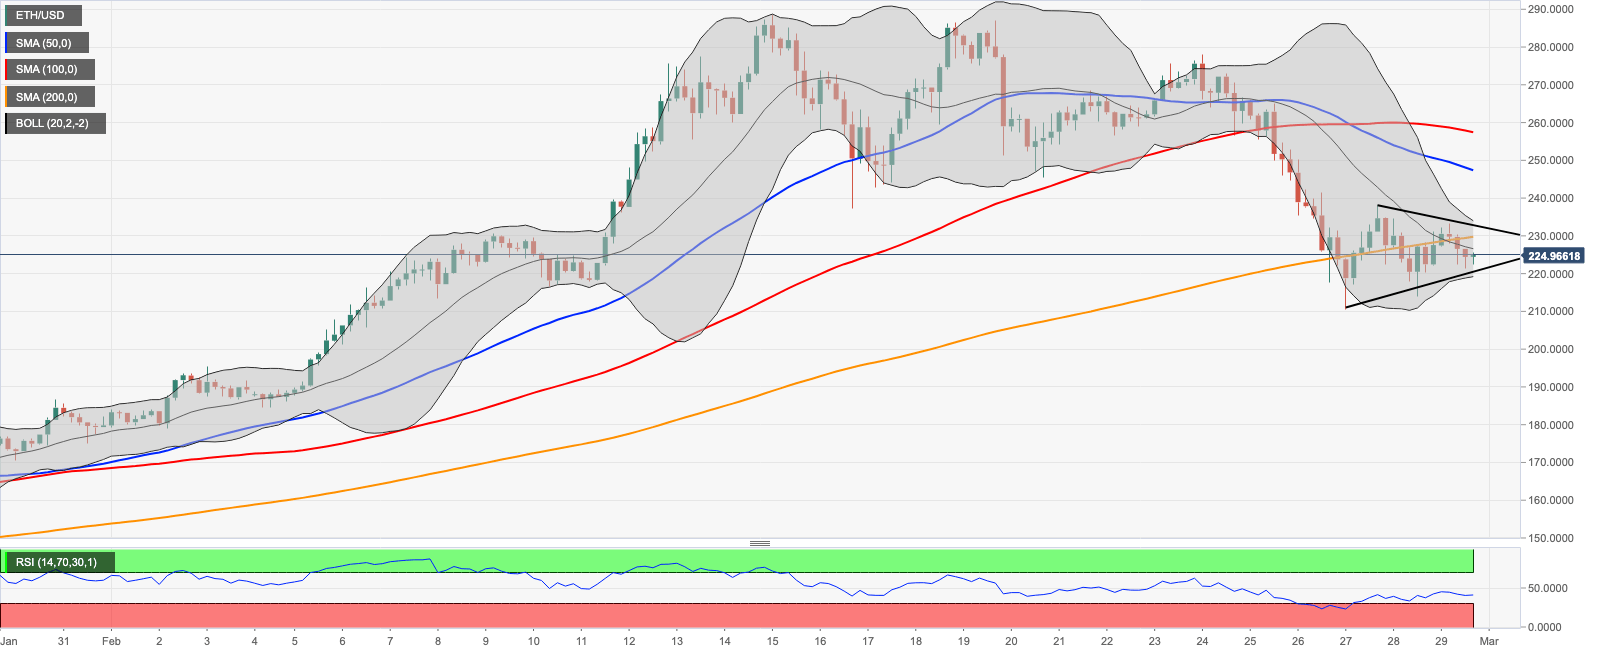
On the intraday level, ETH/USD is moving within a triangle pattern, which may result in a strong movement depending on the direction of the breakthrough. The upper line of the triangle is currently at $232.85. It is reinforced by SMA100 1-hour at $230. If this resistance area is cleared, the upside momentum may gain traction with the next target at $248.00 (SMA200 1-hour and SMA50 4-hour) closely followed by psychological $250.00.
If the price moves below $220.50, which is the lower boundary of the triangle reinforced by the lower line of 4-hour Bollinger Band, the sell-off will gain pace with the next bearish aim at $210.57 (the recent low hit on February 27). This area is likely to slow slow down the downside trend and trigger the rebound; otherwise, the price will quickly move down to test $200.00.
ETH/USD 4-hour chart
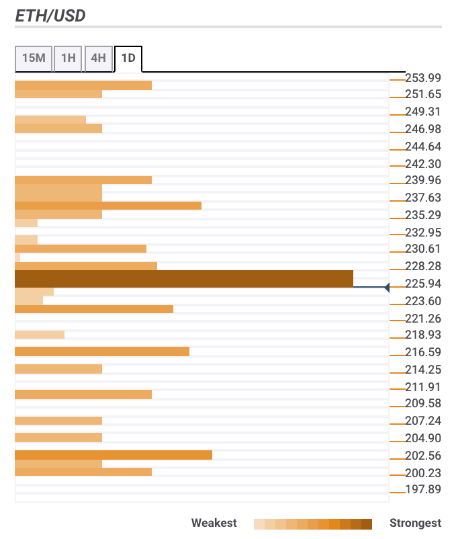
ETH/USD confluence levels
Resistance 1 – $228.00 (38.2% Fibo retracement daily, $23.6% Fibo retracement weekly, SMA10 4-hour);
Resistance 2 – $230.00 (SMA200 4-hour, 23.6% Fibo retracement daily)
Resistance 3 – $237.00 (38.2% Fibo retracement weekly)
Current price – $225.00
Support 1 – $222.00 – the lowest level of the previous 4-hour
Support 2 – $261.00 – the lower line of the daily Bollinger Band, Pivot Point 1-day Support 1
Support 2 – $210.00 – the lowest level of the previous week