- ETH/USD recovered from the recent lows to trade above $252.
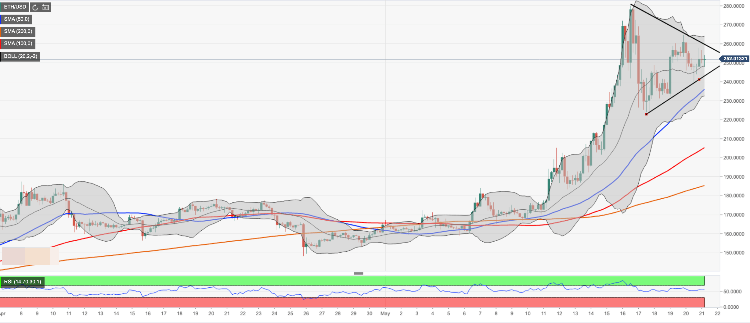
- A triangle pattern limits the short-term movements.
ETH/USD regained ground after an initial move below $248 handle during early Asian hours. The second largest coin with the current market capitalization of 26.7 billion hovering at $252, unchanged on a daily basis and down 1.3% since the start of Tuesday. Ethereum has been moving in sync with the market recently, as there are few fundamental events that might have fed price momentum.
Ethereum’s technical picture
On the intraday basis, ETH/USD is moving within a triangle pattern visible on the 4-hour interval. It means we will need to see a sustainable breakthrough in either director to create a strong price momentum. The lower boundary of the pattern is located at $243. A sustainable move below this handle will open up the way towards the next bearish aim of $236 (SMA50 4-hour) and $233.60 (the lower boundary of 4-hour Bollinger Band). Meanwhile, the critical short-term support comes at a psychological $230. It is likely to protect the coin from a deeper sell-off and trigger a rebound.
On the upside, we will need to pass $260 with the upper line of the triangle locates on approach to this psychological barrier. Once it is cleared, the upside is likely to gain traction with the next focus on $264 (the upper boundary of 4-hour Bollinger Band) and $270.
ETH/USD, 4-hour chart

