- ETH/USD retreats from a multi-month high amid technical correction.
- The critical support is created by SMA50 weekly at $228.
ETH/USD topped at $272.15 during early Asian hours and retreated to $252 by the time of writing. Despite the setback, ETH is still nearly 20% higher from this time on Wednesday with over 56% of gains on a week-on-week basis. Ethereum is the second largest coin with the current market value of $28.3 billion and an average daily trading volume of $15 billion, which is the highest on record.
Looking technically, ETH/USD is supported by $246.00. This handle is strengthened by the middle line of the 1-hour Bollinger Band. Once it is cleared, the sell-off may continue with the next focus on $240 and further on $237.60, which is the upper boundary of the daily Bollinger Band. Another strong support is created by a confluence of SMA50 weekly and SMA50 daily around $228. The daily RSI (Relative Strength Index) stays in the overbought territory, though there are no clear signals of reversal as of yet. It means that the price will resume the upside movement once the short-term technical correction is over.
On the upside, a sustainable move above the recent high of $272.15 will bring psychological $300 in focus. The last time ETH/USD traded above this handle in August 2018. Once it is cleared, the upside is likely to gain traction with the next aim at $379 (SMA100 weekly)
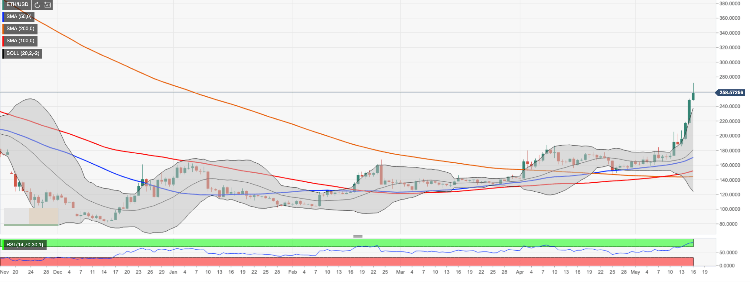
ETH/USD 1-day chart