- ETH/USD is hovering above the red Ichimoku cloud.
- The RSI indicator is trending inside the overbought zone.
ETH/USD daily chart
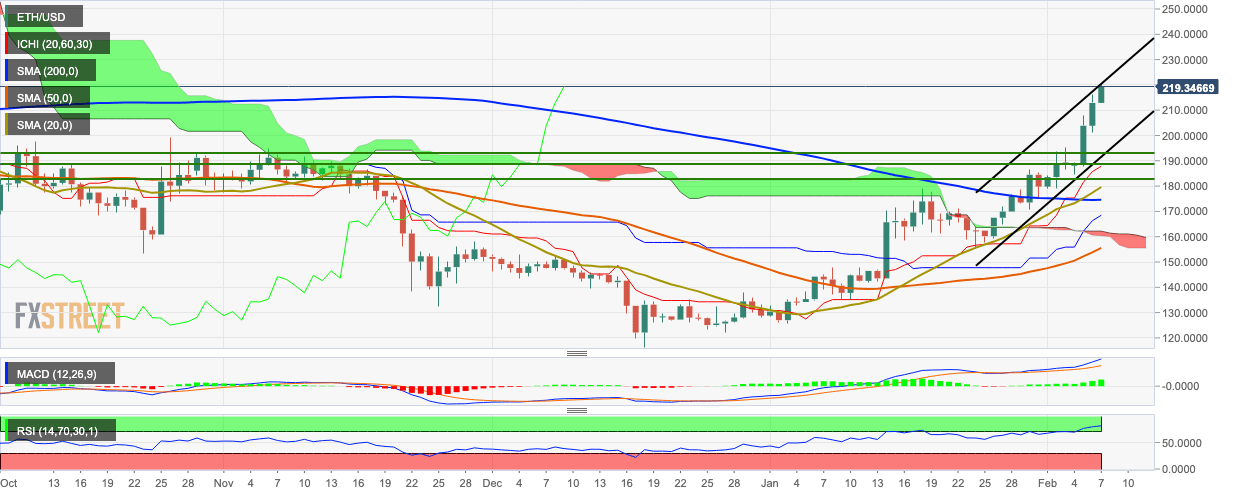
ETH/USD charted seven straight bullish days wherein it rose from $179.70 to $219 – a 22.25% increase in valuation. The price is trending in an upward channel formation and is looking to break above the resistance provided by the upward trending line. The price is also hovering above the red Ichimoku cloud, SMA 20, SMA 50 and SMA 200. The MACD indicates increasing bullish momentum, while the RSI is trending around 82.35, inside the overbought zone. This shows that the asset is overpriced and may face temporary bearish correction before the bulls take back control.
