- Ethereum trades near the lower limit of its horizontal channel.
- $250 aligns as a difficult resistance to break.
Ethereum failed to break above $250 for the fourth time in June on Wednesday and turned south. The ETH/USD pair closed the previous three days in the negative territory and lost nearly 6% during that period. With the trading action in cryptocurrency markets turning subdued on Saturday, the pair seems to have gone into a consolidation phase. As of writing, Ethereum was up 0.45% on a daily basis at $230.50.
ETH/USD technical outlook
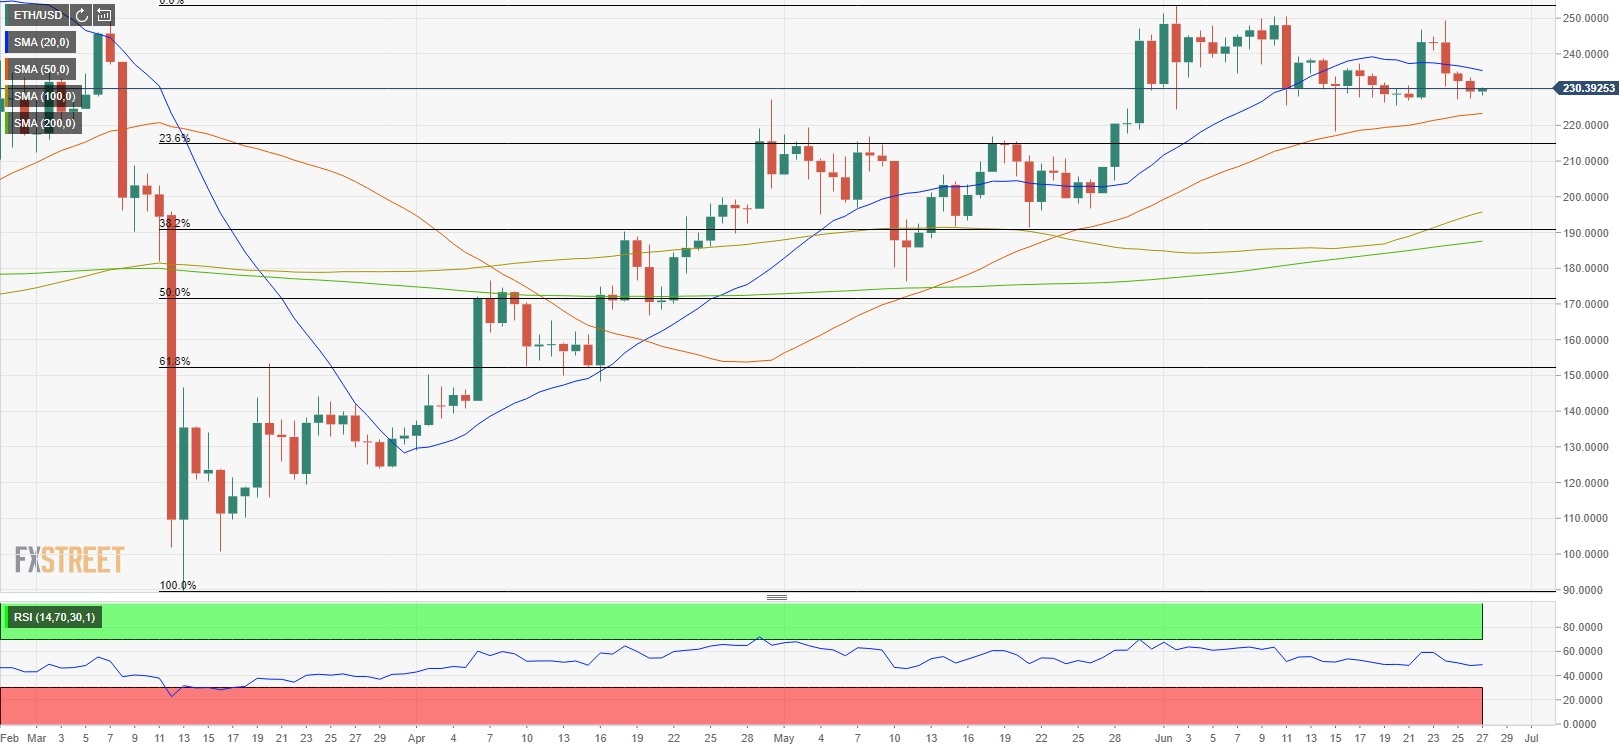
Since early June, Ethereum has been fluctuating between $250 and $220. Currently, the 50-day SMA is aligning near the lower limit of this range, suggesting that a daily close below that level could cause the bearish momentum to gather strength. The Fibonacci 23.6% retracement level of the three-month-long rally that started in March is the next support at $215 ahead of $200.
On the upside, the 20-day SMA is the initial resistance at $235 ahead of $250. Only a decisive break above $250 could cause the near-term outlook to turn bullish.
Ethereum daily chart
Additional technical levels
