- ETH/USD is trading between the moving average support and resistance.
- Ethereum price is trading a bullish flag pattern that is likely to culminate in a breakout.
Ethereum price is trading between the support and resistance created by the Simple Moving Averages. The 50 SMA is limiting intraday gains marginally above $450 while the 100 SMA, on the other hand, is offering immediate support at $447. The digital asset declined to test a 10-week low close to $400, but the bulls entered at the demand zone slightly above $420.
The price has recovered slightly from the pits, but the upside has been limited below $460. ETH/USD is trading a bullish flag pattern that is likely to culminate in a breakout. However, the crypto is holding tight to the immediate support at $450. The trend is slightly bearish but the buyers are fighting to avoid further declines in addition to breaking above the immediate resistance at $455 and $460 respectively.
The MACD momentum indicator is also sending bearish signals in the short-term. As mentioned above, the 100 SMA will hold the price in the event the support at $450 gives in. Similarly, a stronger support is observed at $440. If the price falls below this level, Ethereum price will be back to the pits above $400 and the demand zone at $420.
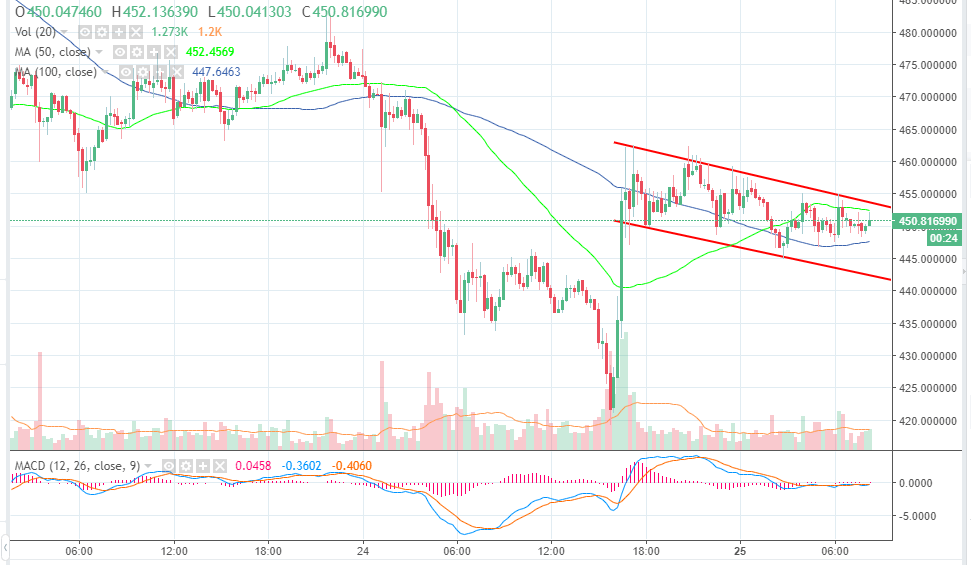
ETH/USD 15′ chart