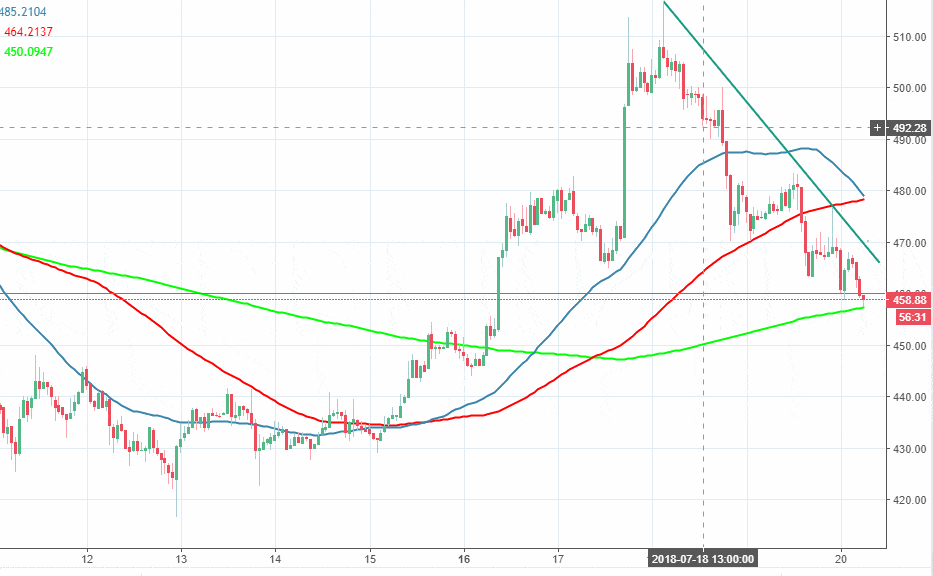
- Ethereum revers the large chunk of recent gains.
- Local support is created by 200-SMA at $450.
Ethereum has been sliding ever since it hit $516 high (July 18). The price of the second largest coin broke $475 support level created by 100-SMA (1-hour chart) and proceeded towards $450. ETH/USD is currently changing hands at $459.
Ethereum’s market value is registered at $46.4B, while the average daily trading volume settled at $1.9B. The coin has lost 3.5% on a daily basis and 1.8% since the beginning of the day. Short-term trend is strongly bearish, while growing volatility may add pressure to the prices.
Ethereum’s technical picture
Looking technically, ETH/USD is supported by 200-SMA at $450 (1-hour chart). Once it is cleared, the sell-off may be extended towards $440 (the upper line of former consolidation rang0 ) and $421 (the lowest level of July 12). On the upside, the resistance is created by $480 with both 50 and 100-SMAs on approach. The psychological $500, followed by $516 (recent high) are likely to cap potential recovery for the time being

