- ETH/USD bulls are intimidated by a cluster of technical indicators on approach to $300.
- The critical support is created by the lower line of daily Bollinger Band.
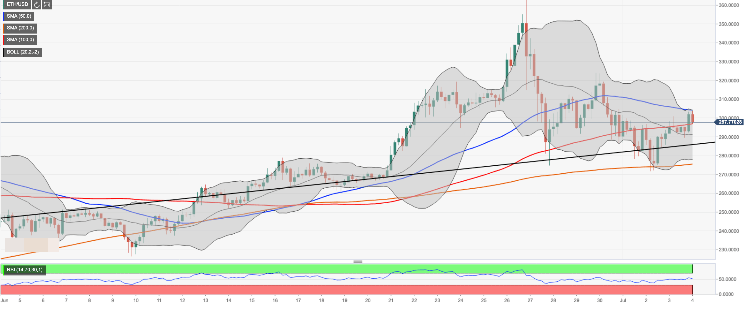
Ethereum, the second largest cryptocurrency with the current market capitalization of $32.0 billion, has been range-bound recently. The coin faced stiff resistance on approach to psychological $300 and settled at $296 by the time of writing. ETH/USD has gained about 1% on a day-on-day basis and lost 1.7% since the beginning of Thursday’s trading.
From the short-term perspective, several unsuccessful attempts to move above $300 barrier bodes ill for ETH bulls and create risks of the extended sell-off with the initial aim at at the upside trendline currently at $285.00, followed by the recent low of $275.00 (the current low, SMA200 (Simple Moving Average) 4-hour and the lower edge of 4-hour Bollinger Band). A sustainable move below this area will open up the way towards the next bearish aim of $270.30 (SMA50, daily chart) and $256 (the lower edge of 1-day Bollinger Band).
On the upside, $300.00 is a hard nut to crack as it is strengthened by a confluence of strong technical indicators including SMA200 1-hour, SMA50 4-hour and the upper boundary of 4-hour Bollinger Band. Once it is out of the way, the recovery may be extended towards $332.00 (the upper edge of 1-day Bollinger Band), which will signal that the downside correction is over.
ETH/USD, 4-hour chart