- ETH/USD has found resistance at both the SMA 20 and SMA 50 curves.
- 20-day Bollinger width has narrowed, indicating decreasing market volatility.
ETH/USD buoyed the price up slightly from $174.60 to $174.85 in the early hours of Tuesday. It looks like the bulls want to retake control of the market after the bears took over on Monday and brought ETH/USD down from $175.71 to $174.60. The hourly ETH/USD price chart shows us two significant price actions. Firstly, after steadily dropping to $174.27, the price spiked up to $177.25 in one hour. Just four hours later, the price plunged from $176.71 to $173.
ETH/USD daily chart
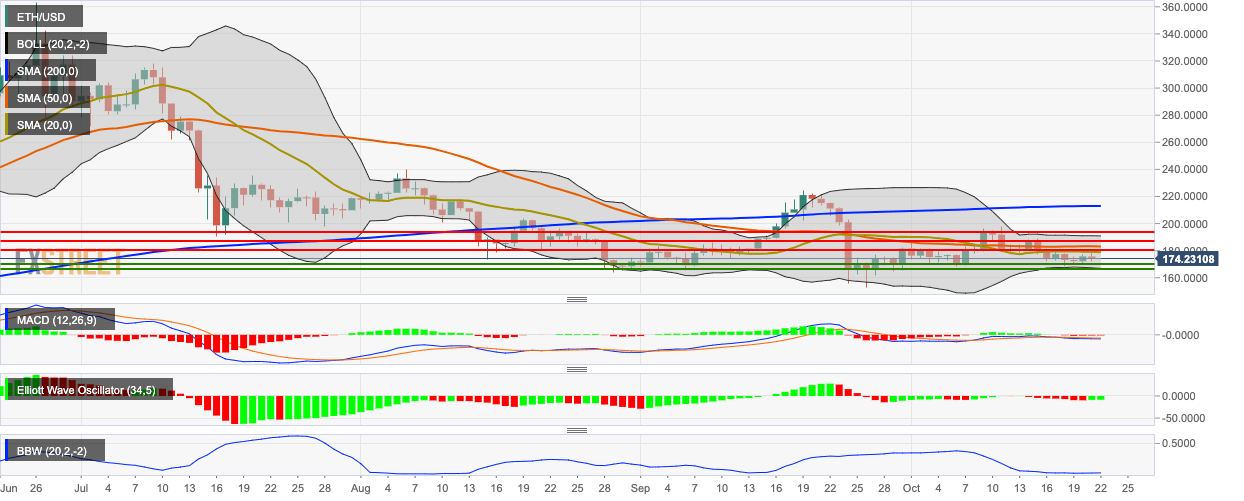
ETH/USD has to overcome resistance at the 20-day Simple Moving Average (SMA 20) and SMA 50 curves. The 20-day Bollinger band has narrowed significantly, which indicates decreasing market volatility. The Moving Average Convergence/Divergence (MACD) shows sustained bearish momentum, while the Elliott Oscillator has had two green sessions following seven consecutive red sessions.
