- Ethereum price on Monday was seen nursing minor losses of some 1.3%, cooling just marginally after the chunky jump on Sunday.
- ETH/USD formed a bullish Doji on Sunday, as seen with several of its peers across the board.
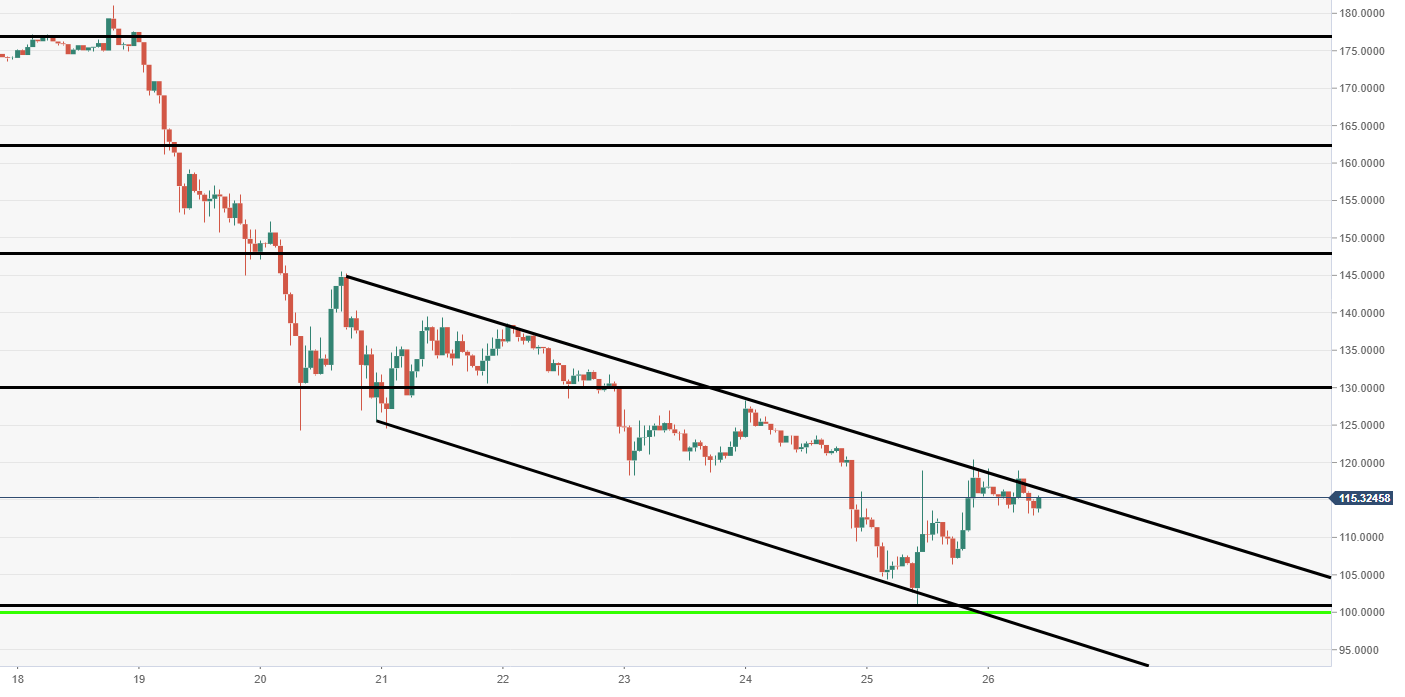
- Price is moving within a descending channel pattern, subject to a breakout from the bulls.
ETH/USD daily chart
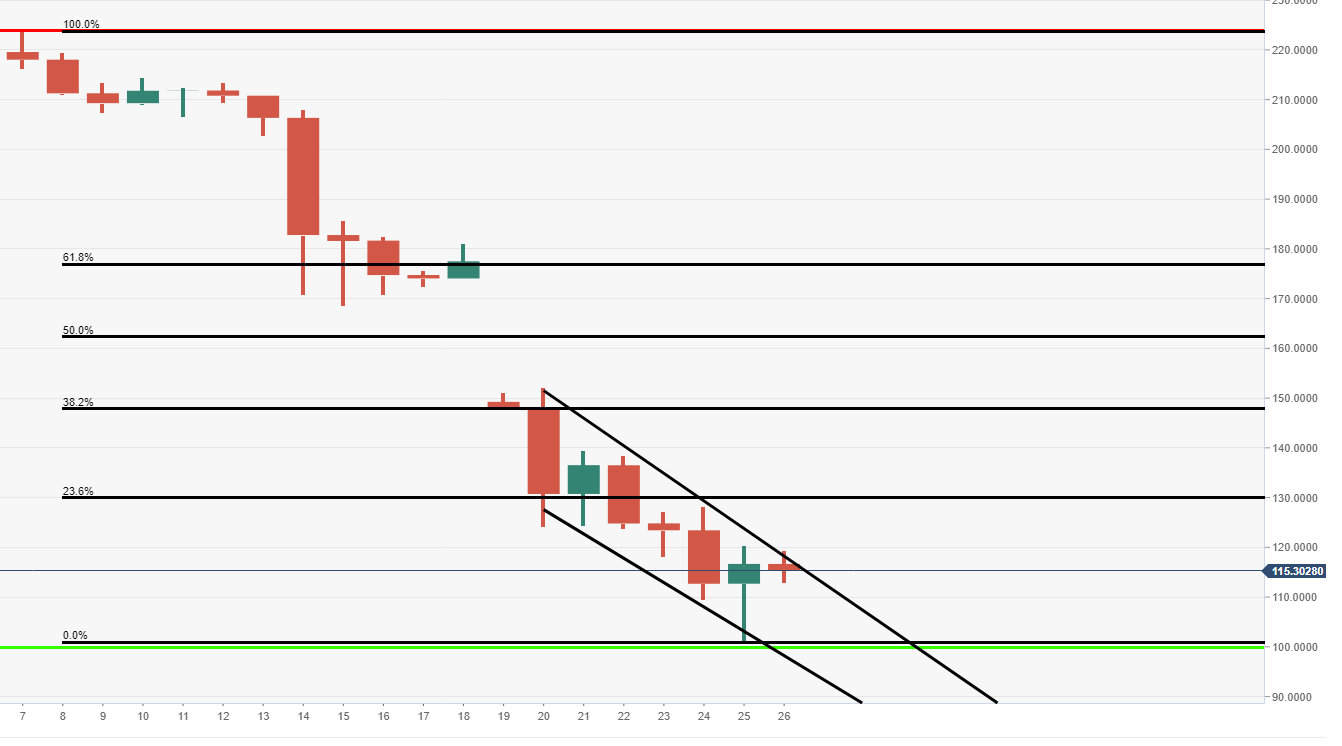
Spot rate: 115.52
Relative change: -1.30%
High: 119.46
Low: 112.83
Trend: Bearish/Neutral
Support 1: 104.95, lower part part of recent range block.
Support 2: 93.24, daily pivot point support.
Support 3: 85.50, daily pivot point support.
Resistance 1: 119.25, upper part of channel.
Resistance 2: 124.40, daily pivot point resistance.
Resistance 3: 132.14, daily pivot point resistance.
ETH/USD 60-minute chart
- The clarity of the descending channel formation can be seen via the 60-minute chart view, subject to a potential breakout to the upside.