- The 50% Fib retracement will limit gains towards $500, while the 61.8% is supporting the price at $483.
- ETH/USD has formed a short-term bullish flag pattern pending another upside breakout in the medium-term.
Like most of the cryptocurrencies on Thursday, Ethereum price is also correcting higher. Ethereum broke the support at $470 as I had covered during the analysis yesterday and traded in the demand zone at $450 before the trend reversed. It formed a short-bullish flag pattern towards the end of the session but spiked again during the Asian trading hours today. The upside is, however, capped at $490 and attempts to break above this level have been constricted by selling pressure.
ETH/USD has formed another short-term bullish flag pattern pending yet another bullish flag pattern that could break past $490 and approach the key resistance zone at $500. However, the buyers will have to deal with more resistance at the 50% Fibonacci retracement level. A weak bullish momentum is forming on the chart, besides the stochastic is at 32% and sending bullish signals for the short-term.
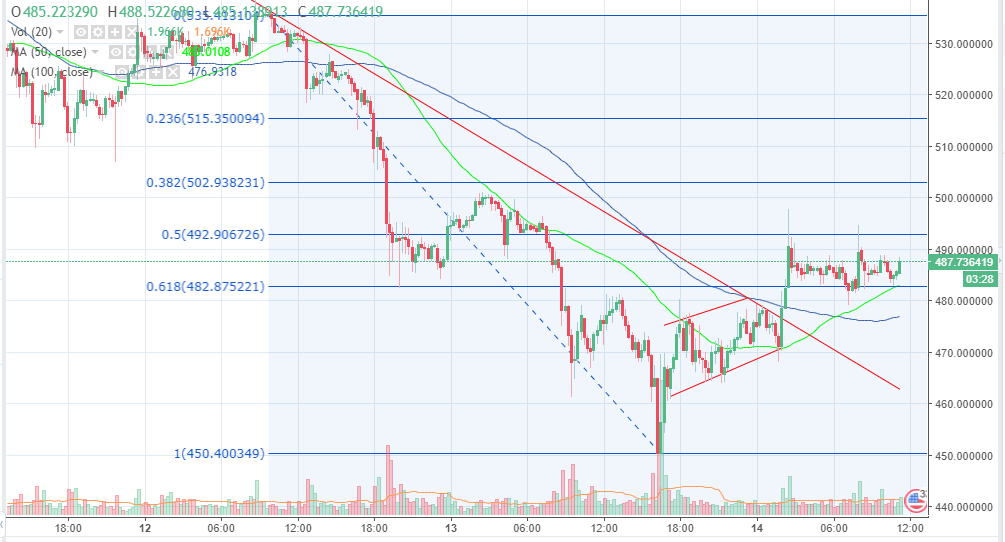
The 50 SMA is above the longer term 100 SMA and supporting the price at $483. The 61.8% Fib retracement level with the previous swing high of $535 and a low of $450 is confirming the short-term support at the 50 SMA. The 100 SMA, on the other hand, will stop declines below $480 above the major support and demand zone at $470.
ETH/USD 15′ chart