- ETH/USD had flown up from $152.85 to $172.58 this Thursday.
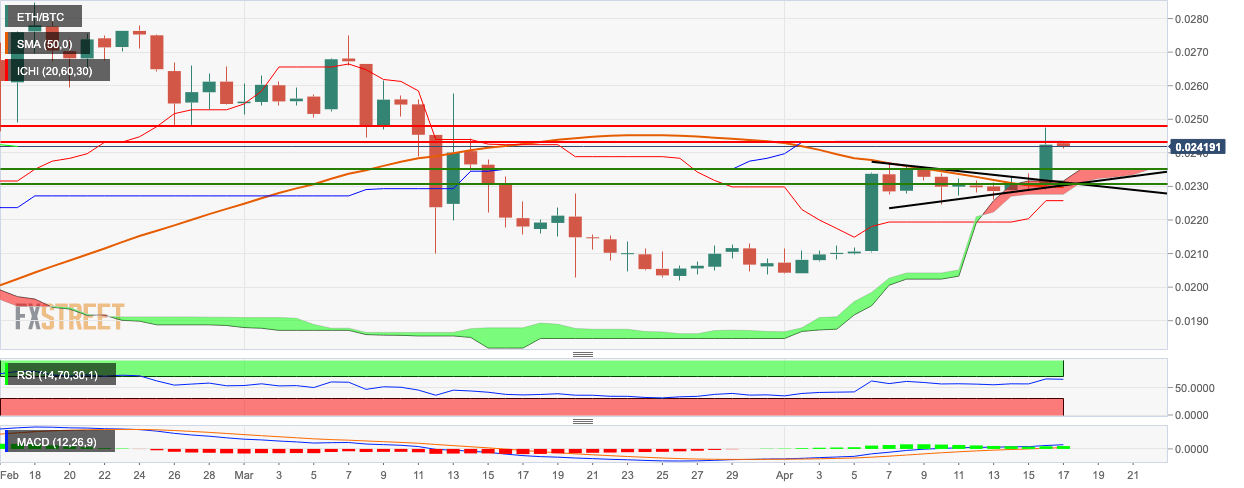
- ETH/BTC lost momentum at the 0.0243 resistance level.
ETH/USD daily chart
ETH/USD faced a bearish start to the day following an overtly bullish Thursday. The price has gone down slightly from $172.58 to $171.69 and is currently facing resistance at the downward trending line and the SMA 200 curve. This Thursday, ETH/USD broke past the SMA 50 during its ascent from $152.85 to $172.58. The Elliott Oscillator has had two green sessions following two straight red sessions.
ETH/BTC daily chart
ETH/BTC bounced off the red Ichimoku cloud and went up from 0.023 to 0.0243 this Thursday, breaking above the pennant structure, in the process. This breakout was an early indicator of the crypto market’s overall bullish movement this Thursday. Currently, tt looks like the bulls have run out of steam near the 0.0243 level as ETH/BTC has dropped a bit to 0.0242. The RSI indicator is trending horizontally around 67.27, next to the overbought zone.
Key levels
-637226948169148401.png)

