- Ethereum price closing in on a breakout towards a 20% decline.
- ETH could re-test the support level at $1724 but overhead pressure could push the price further south.
- Technical outlooks from RSI and MACD affirm this bearish trend.
Ethereum price ended the day trading in the red on Thursday to close the day below $2120. It, however, started the day on Friday trading in the green as the underlying pressure from the bulls attempted to push the price towards the dynamic resistance created by the 50-simple moving average (SMA) at around $2200.
However, pressure from the bears scuttled the attempts to push ETH price any further as it is currently trading in the red at $2107 according to crypto broker Coinbase.
Today’s decline in Ethereum price has been attributed to the news that there has been a delay in the implementation of the London hard fork, which is expected to reduce ETH transaction fees. That notwithstanding, technical evidence shows that ETH could be preparing for a massive decline.
However, should the dip happen it could present a buying opportunity so you may want to check out our how to buy cryptocurrency guide.
Ethereum Price Bearish Run Set to Continue?
The 4-hour chart indicates that the ETH price has declined a resounding 8% at the time of writing after a tremendous rise from the June 22 low as it tested a new support level at $2100 defined by the 100-SMA. However, it faces resistance at $2200 as bears are determined to bring the prices back to the June 22 low at $1730. This appears to be a warning to bulls as the bullish pin bar witnessed in the earlier trading sessions today could hold them in a bull trap.
There appears to be significant overhead pressure to push the price downwards at the time of writing. Moreover, it seems that Ethereum will not recover down from this level before the end of the trading day today. If the ETH price closes the day below the 100-SMA will confirm this break downwards from the support at $2100. Consequently, investors may have to be ready for a fall in a measured move downwards to $1724 representing a 20% drop from the current price.
ETH/USD 4-Hour Chart
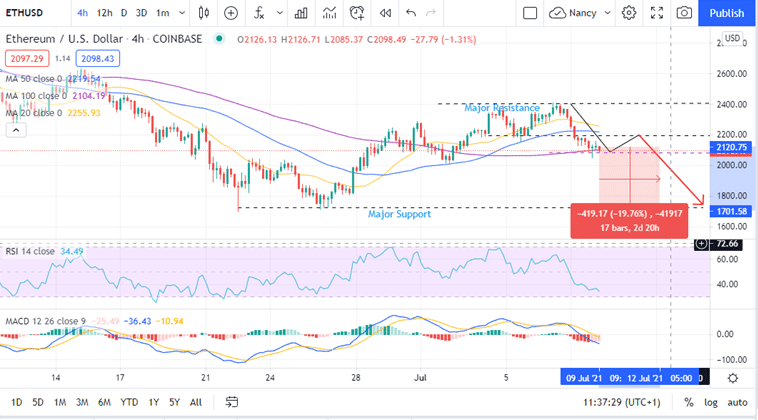
Note that technical outlooks from the Relative Strength Index (RSI) and the Moving Average Convergence Divergence (MACD) affirm this bearish outlook. A significant dive by the RSI towards the oversold region increases pessimism among the bulls confirming that the bears are still in control of the market. Moreover, after the MACD line (blue) issued a call to sell when it crossed the signal line in earlier trading sessions on Thursday, it has continued to show a downward trend. The onslaught downwards will be affirmed when the MACD moved further away from the zero line into the negative region.
On the upside, a daily close above $2200 would negate the bearish forecast suggesting that Ethereum could still be among one of the next cryptocurrency to explode, as it seeks to test the dynamic resistance level defined by the 50-day SMA at $2220 and the 200-day SMA at $2250.
Looking to buy or trade crypto now? Invest at eToro!
Capital at risk
