- Ethereum price uptrend fails to attract investor support as Twitter sentiment dips.
- Ether’s network activity tumbles amid decreased on-chain transactions.
Ethereum price had extended the recovery above $2,000 in the wake of the recent losses to $1,700. The pioneer smart contract token brushed shoulders with $2,300 before the ongoing correction came into the picture.
According to IntoTheBlock, the impending Ethereum improvement proposal (EIP) has failed to excite investors, especially with the open interest on derivative trading platforms dwindling. The EIP-1559 is an upgrade that will be implemented with a hard fork called London to reduce the high transaction fees and improve network security, among other key features.
Ethereum uptrend lacks power amid waning on-chain metrics
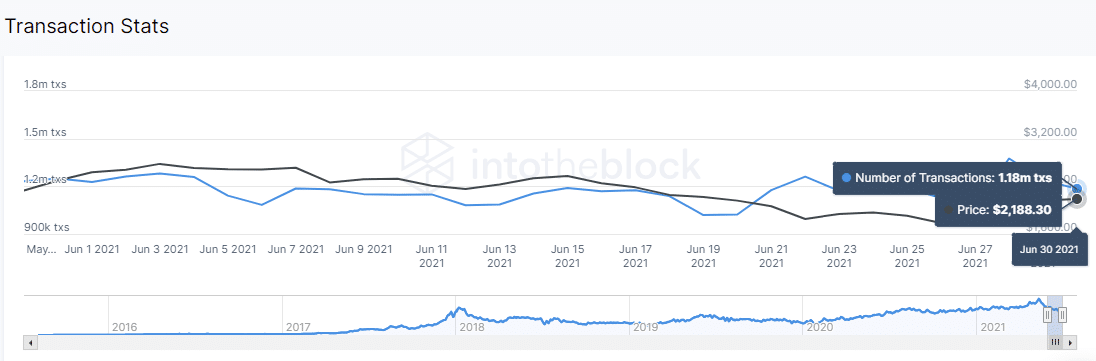
IntoTheBlock, a leading on-chain metrics analysis platform, highlights an ongoing dip in the number of transactions on the Ethereum blockchain. Relating these metrics to price action often gives insight into the direction the token will take and can be a useful guide for when to buy cryptocurrency.
At the moment, 1.18 million transactions have been recorded on the network, tracked on a 30-day trailing average, a significant dip from the 1.38 posted on June 30. The decrease suggests that network activity is going down. In other words, the level of interaction is dwindling, affecting speculation for gains to higher levels.
Ethereum transactions dip further
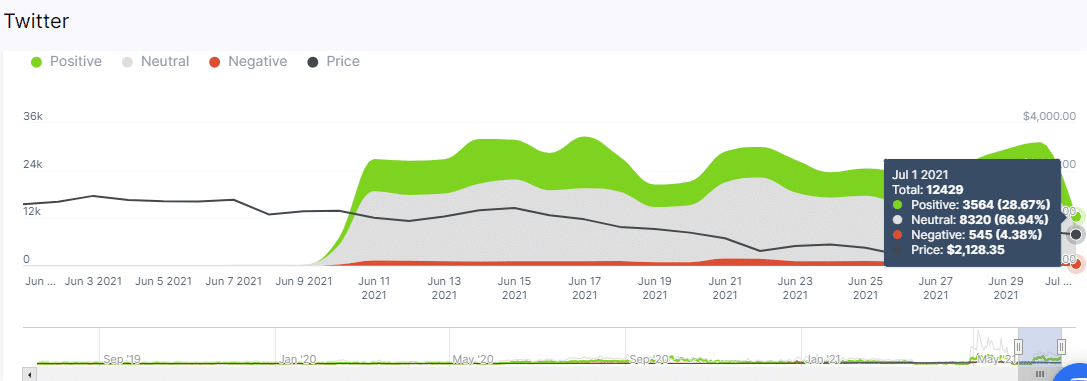
Meanwhile, the Twitter positive sentiment is on a downward trend, ignoring the development news regarding EIP-1559. This metric uses an algorithm that tracks sentiment in tweets mentioning Ethereum. According to the chart below, positive sentiment toward Ether currently holds at 28.6% from 35% on June 30. On the other hand, negative sentiment has remained relatively stable at 4% over the last 30 days.
Ethereum price positivity on Twitter in decline
Ethereum price massive correction may trigger at $2,100
Ethereum price is exchanging hands at $2,135 at the time of writing. The rejection from $2,300 seems to be gaining momentum, accentuated by resistance from the 50 Simple Moving Average (SMA).
Support at $2,100 is the bulls’ hope of averting potential losses. However, with a weak fundamental front, buyers on crypto trading platforms may be fighting a losing battle.
Note that the Relative Strength Index (RSI) seems to be holding at the midline, hinting at possible sideways trading. Nonetheless, a movement toward the oversold region will call more sellers into the market and eventually pull Ethereum price toward $2,000.
The Moving Average Convergence Divergence (MACD) has sustained a bullish signal for three days but currently illuminates bullish exhaustion. Watching this tool in the subsequent sessions may help validate the next trend.
ETH/USD 12-hour chart flipping red
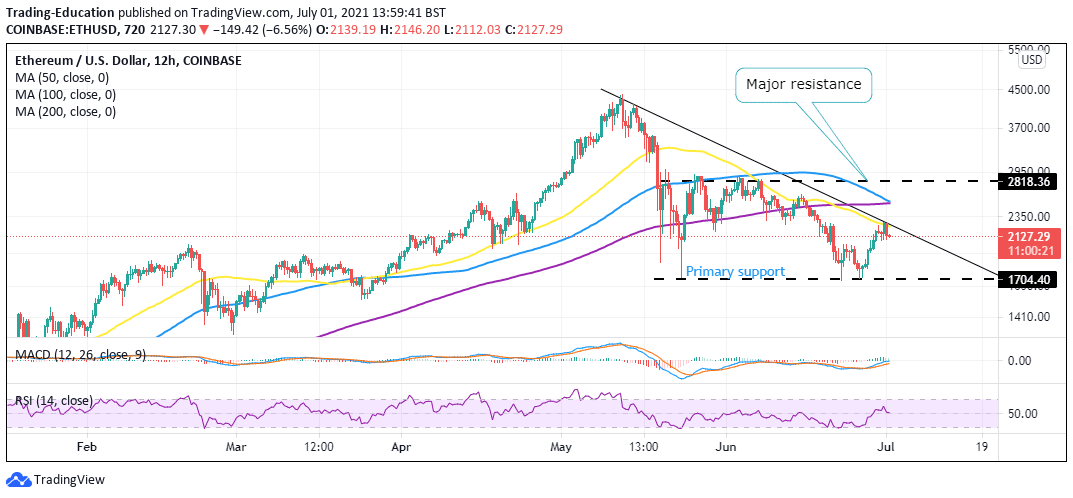
The exact timeframe illustrates a descending triangle pattern that could mature in the coming days or weeks. If the uptrend to $2,800 does not confirm, investors should be belting up for a colossal downing, perhaps beneath the recent support at $1,700.
Looking to buy or trade Ethereum now? Invest at eToro!
67% of retail investor accounts lose money when trading CFDs with this provider. You should consider whether you can afford to take the high risk of losing your money.