The 1-hour chart shows that there is still room for growth.
Ethereum must step above $150 and focus on $160 for a sustainable recoil to higher levels.
ETH/USD embarked on another upside move above $130 following the declines on Monday. A high was formed around $139 on Tuesday. While the bullish momentum seems to be losing steam short of $140, the 1-hour chart shows that there is still room for growth. However, traders must wait for a confirmation that is likely to be signaled by ETH/USD breaking above $140.
ETH/USD daily Confluence Detector levels
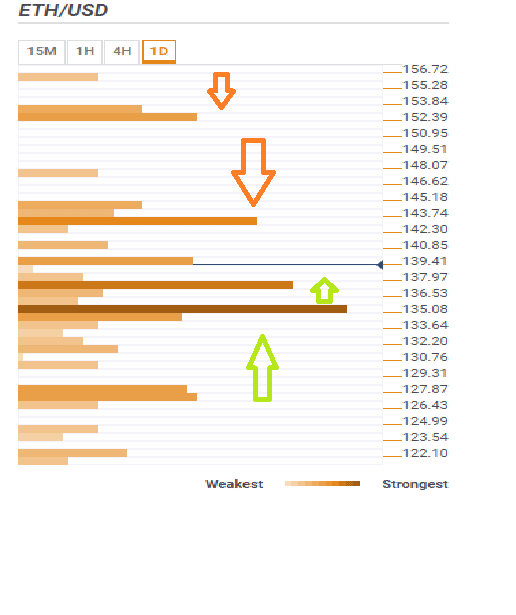
The first support is seen slightly below Ethereum’s current market value at $139.74 and extends to the level at $135.08. If this level caves in, then we expect ETH/USD support to reach the level highlighted by $126.31. The confluence of indicators at these levels include:
100 SMA 1-hour
Previous low 1-hour
Bollinger Band Middle curve 15-minutes
5 SMA 1-hour
Previous low 4-hour
200 SMA 1-hour
50 SMA 4-hour
Bollinger Band 1-hour Lower curve
200 SMA 4-hour
Previous week low
61.8% Fib retracement 1-minute
Marginally above the current price, the bulls will come face to face with the resistance at $140.85 highlighted by the Bollinger Band 4-hour upper and the 100 SMA 4-hour confluence of indicators. Once this level is cleared, expect the upside to remained without significant barriers until the price hits $143.74; resistance shown by the 38.2% Fib retracement 1-minute chart, the Pivot point 1-day R1 and the 38.2% Fib level 1-week chart confluence of indicators.
Further movement to the north will be marked by a correction above $150 and the critical resistance at $152.39; the 23.6% Fib retracement level on the 1-minute chart. Essentially Ethereum must step above $150 and focus on $160 for a sustainable recoil to higher levels.