- ETH/USD has gone down from $211.15 to $206.75 in the early hours of Tuesday.
- The hourly chart shows that SMA 50 is about to cross over the SMA 20 curve.
ETH/USD daily chart
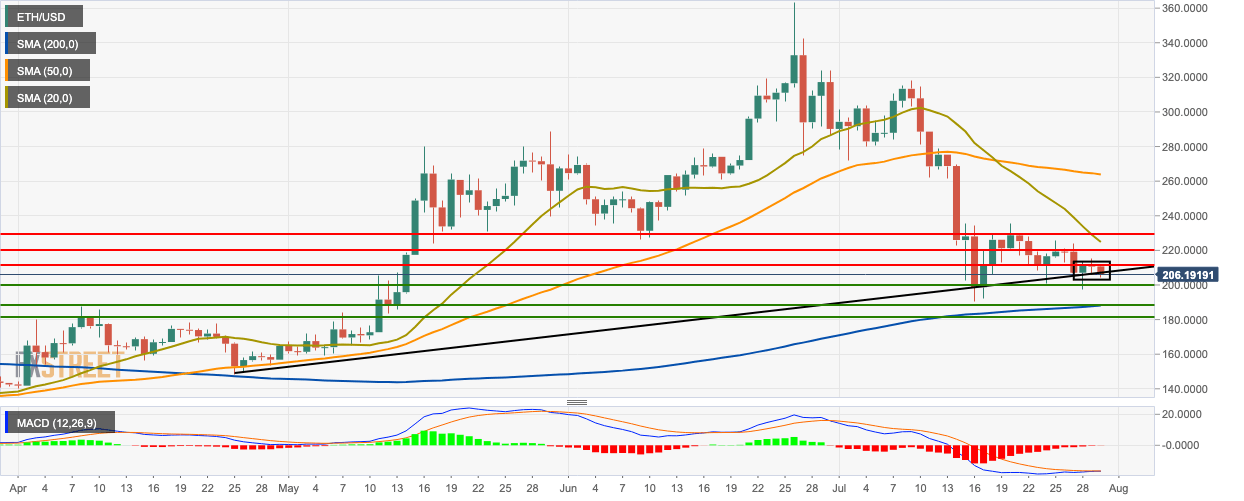
The daily ETH/USD chart is trending in a flag formation and has found support on the upward trending line. The price is trending below the 20-day simple moving average (SMA 20) and SMA 50 curves. The moving average convergence/divergence (MACD) indicator shows decreasing bearish momentum.
ETH/USD 4-hour chart
-637000546649352197.png)
The 4-hour chart has found resistance in the green Ichimoku cloud. The chart is trending below the SMA 200, SMA 50 and SMA 20 curves, with the SMA 20 acting as immediate market resistance. The relative strength index (RSI) indicator was trending in the neutral zone before it dipped to 40.60.
ETH/USD hourly chart
-637000547350919080.png)
The hourly chart shows that the bulls gained some momentum around 20:00 UTC this Monday, where they took the price from $209.50 to $211.45. After meeting heavy resistance, the price plummeted to $206.15. The price fell below the 20-day Bollinger band, indicating that it was undervalued. The bulls subsequently took the price back inside the Bollinger band. The widening of the 20-day Bollinger jaw indicates increasing market volatility. The Elliot oscillator shows three straight bearish sessions of increasing intensity.
Key Levels
