Home Ethereum Technical Analysis: ETC/USD bears break below key near-term ascending trend line, hear come the sellers again
Crypto News

Ethereum Technical Analysis: ETC/USD bears break below key near-term ascending trend line, hear come the sellers again

  • Ethereum was seen nursing some chunky losses of over 5.5% on Monday.  
  • ETH/USD broke out of a very import near-term supporting ascending trend line, opening the door to further selling.  


ETH/USD 60-minute chart
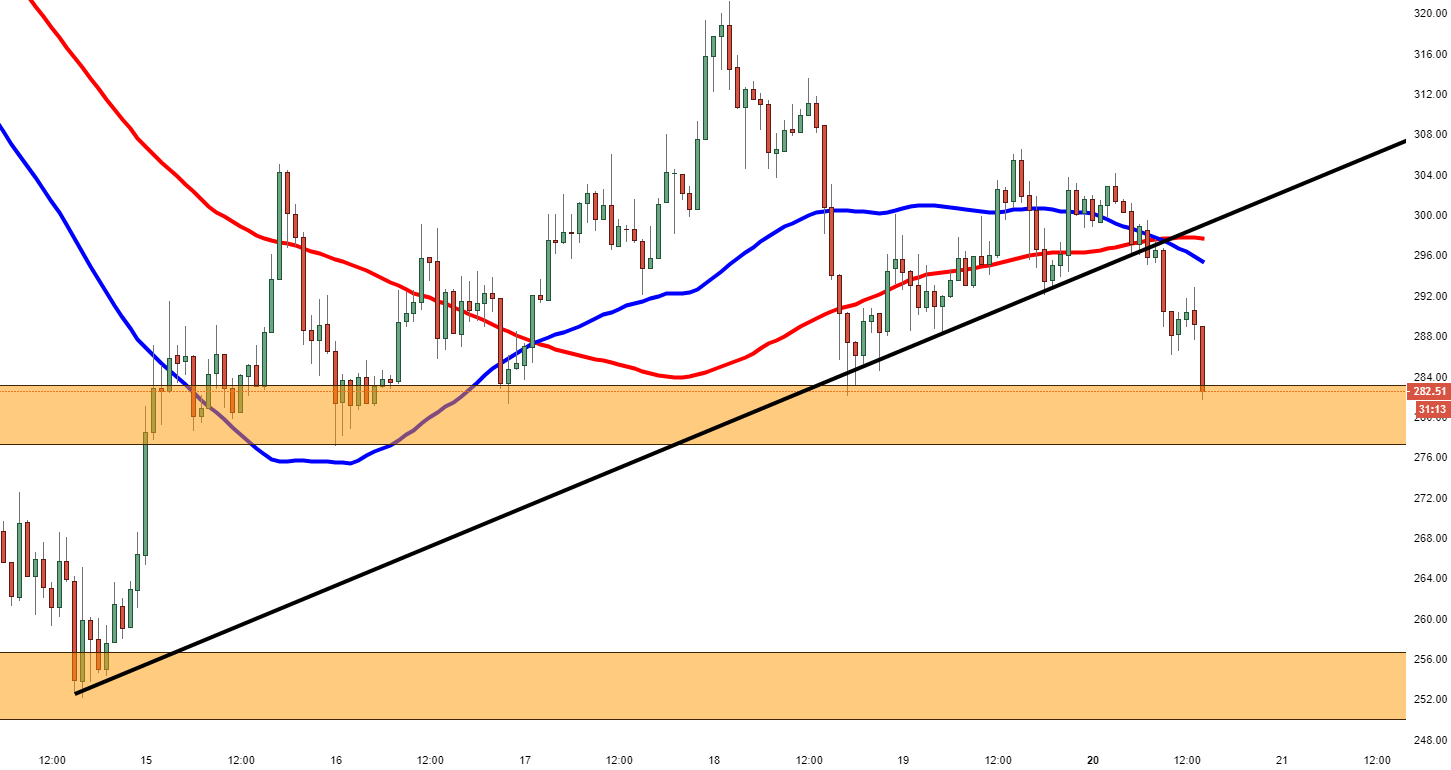


Spot rate:                    282.32

Relative change:        -5.74%

High:                           304.09

Low:                            281.61

Trend:                         Bearish

Support 1:                   282.00, entrance to key near-term demand zone.  

Support    2:                  277.25, 16th August low.  

Support    3:                  256.91, next demand area, low territory of August.  

Resistance 1:              295.05, 50MA.  

Resistance 2:             297.57, 100MA.  

Resistance 3:             298.91,  underneath breached trend line.


FX Street

FX Street

FXStreet is the leading independent portal dedicated to the Foreign Exchange (Forex) market. It was launched in 2000 and the portal has always been proud of their unyielding commitment to provide objective and unbiased information, to enable their users to take better and more confident decisions.