- Ethereum price trading with decent gains of around 2% on Thursday, outperforming its peers
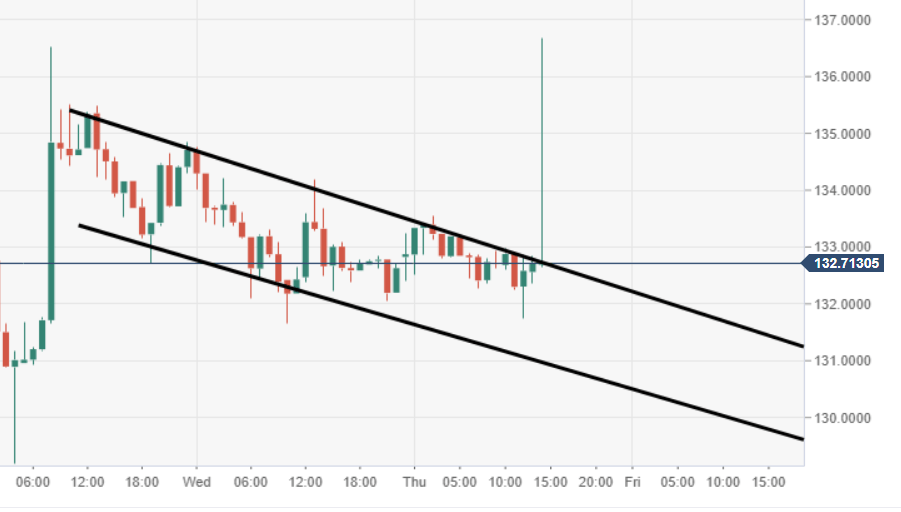
- ETH/USD price action aggressively spikes out from a descending wedge pattern.
Spot rate: 135.25
Relative change: -0.70%
High: 138.68
Low: 131.74
Trends:
Daily SMA20: 137.1
Daily SMA50: 126.24
Daily SMA100: 123.03
Daily SMA200: 165.32
Levels:
Previous Daily High: 134.76
Previous Daily Low: 131.65
Previous Weekly High: 141.86
Previous Weekly Low: 123.9
Previous Monthly High: 167.77
Previous Monthly Low: 101.12
Daily Fibonacci 38.2%: 132.84
Daily Fibonacci 61.8%: 133.57
Daily Pivot Point S1: 131.43
Daily Pivot Point S2: 129.98
Daily Pivot Point S3: 128.32
Daily Pivot Point R1: 134.54
Daily Pivot Point R2: 136.21
Daily Pivot Point R3: 137.65
ETH/USD 60-minute chart
- ETH/USD sees a fast spike higher, appearing to be short-lived out from a descending wedge pattern.
ETH/USD daily chart
- Daily price action is somewhat worrying, as the price is slipping underneath an ascending trend line.

