- Ethereum price is trading in the green, by some 0.55% in the session on Tuesday.
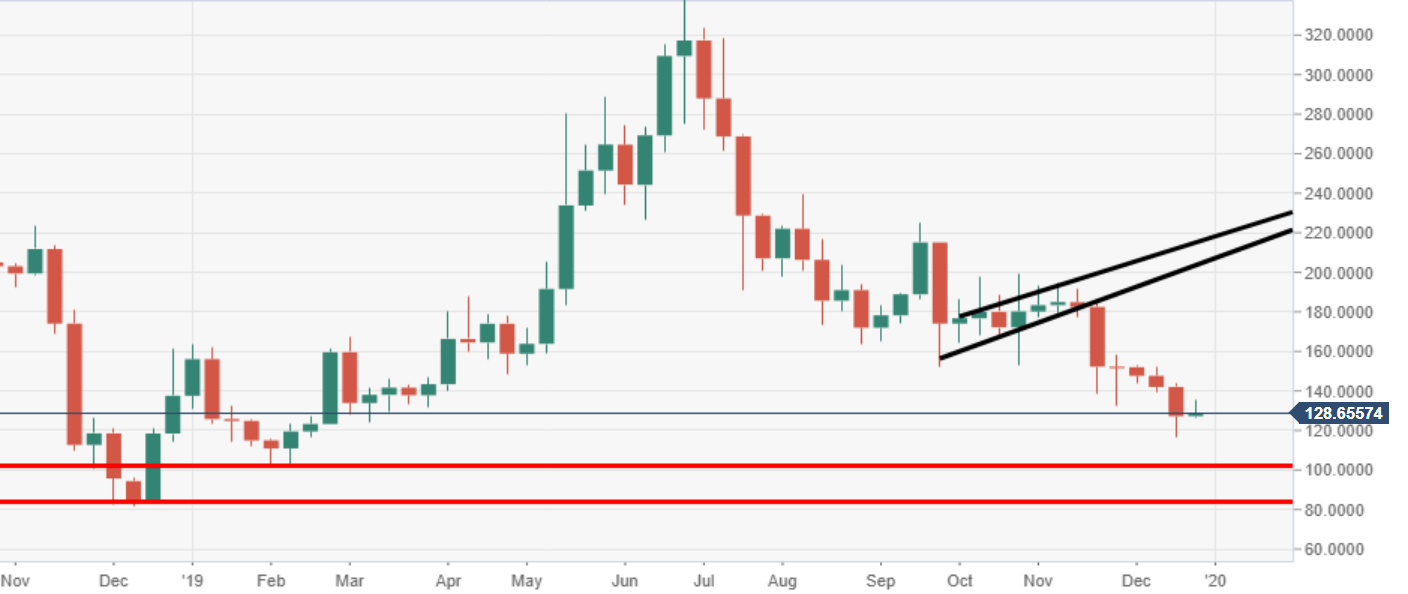
- ETH/USD is running towards its seventh potential week closing in the red.
- Bears maintain full control, with a lack of reversal signs in this stubborn downside trend for now.
ETH/USD weekly chart
The next major support areas to the downside are eyed at $100 and then $80 via the weekly.
ETH/USD daily chart
Price action has formed another bearish pennant structure via the daily, subject to a potential breakout south.
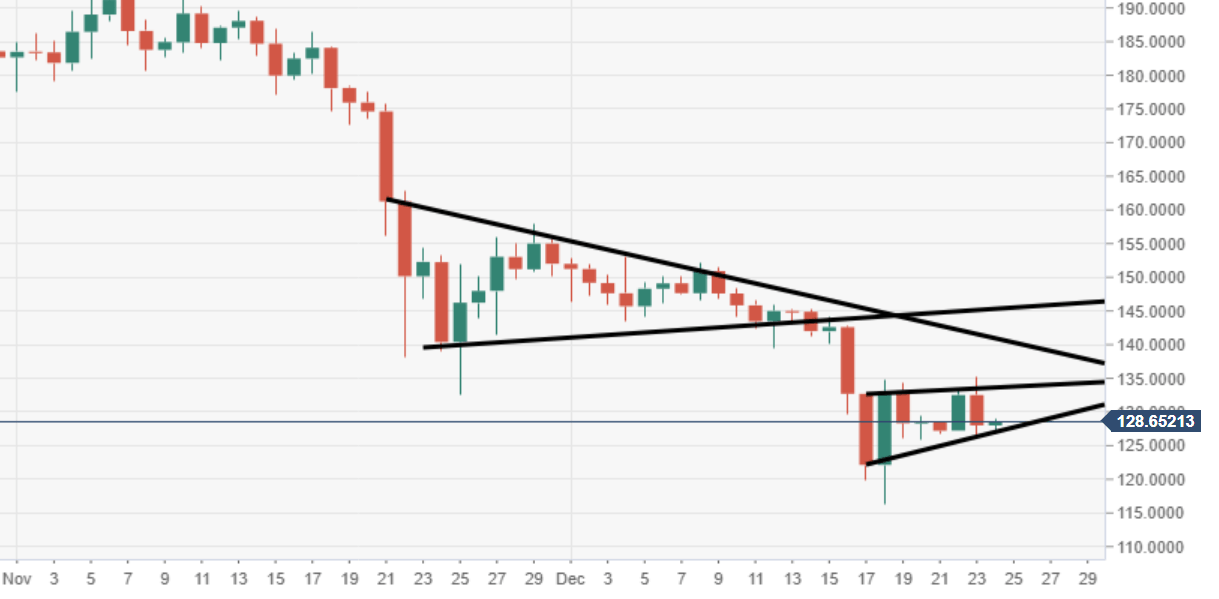
Spot rate: 128.65
Relative change: +0.55%
High: 128.96
Low: 126.84
