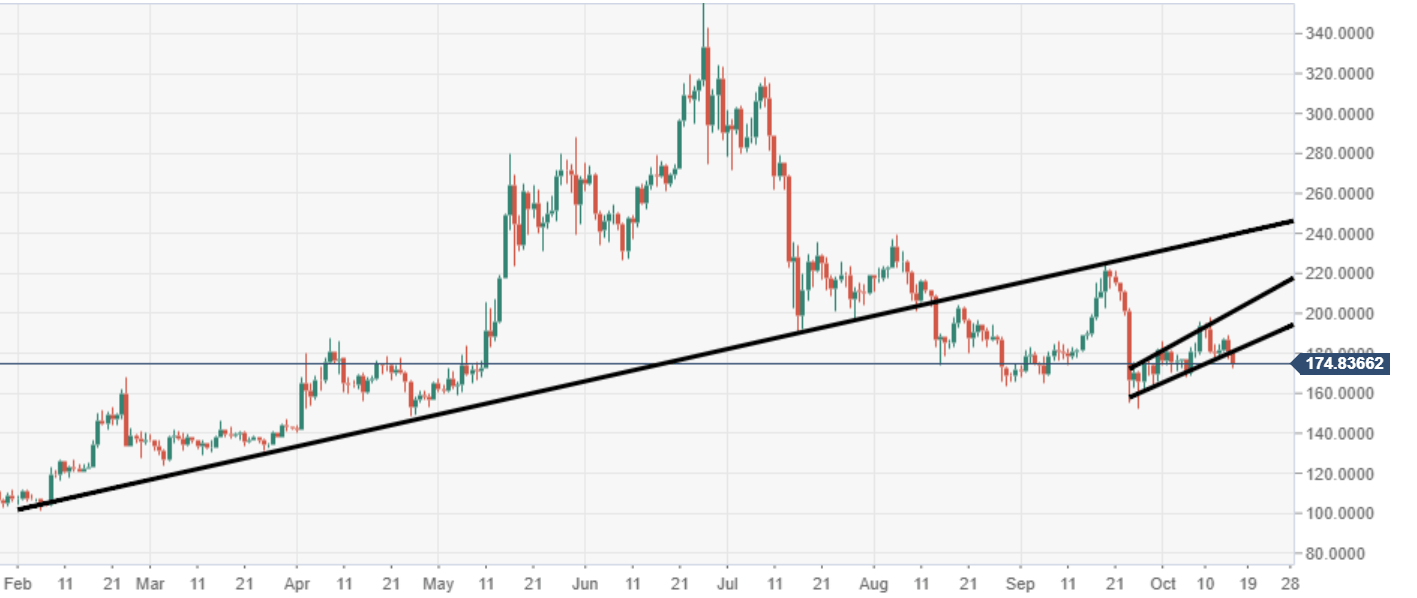
- Ethereum price is trading in the red, down 3.30% the session on Wednesday.
- ETH/USD is breaking out from a bearish flag structure, which is inviting further sellers.
- The price has struggled to escape a bearish trend since June, rallies continue to be sold.
ETH/USD daily chart
Price action has breached a bearish flag structure, leaving the door open to another wave of selling.
ETH/USD 60-minute chart
A near-term bearish pennant structure has been breached via the 60-minute chart view.
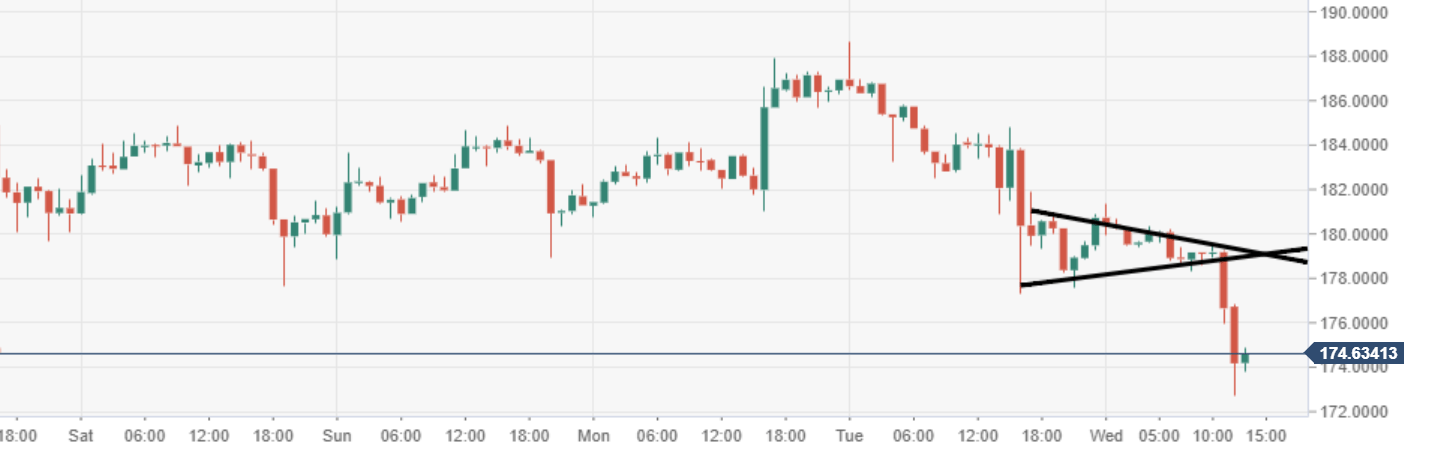
Spot rate: 186.07
Relative change: -3.35%
High: 181.35
Low: 177.29
