- Ethereum price in the second half of Tuesday is trading in the red, down some 2.50%.
- ETH/USD price action remains stuck within a bearish pennant structure, subject to a breakout.
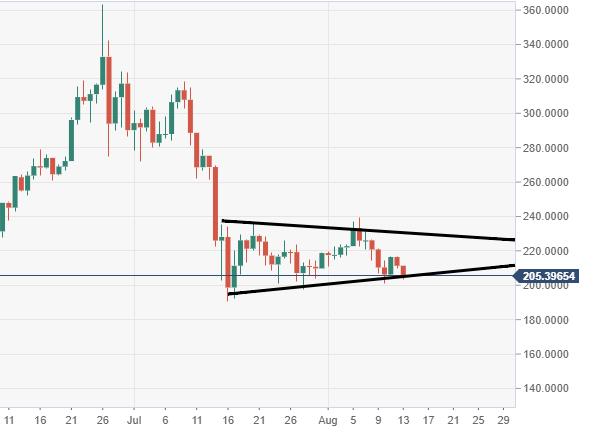
- Price action via the daily chart view is constructing a potential inverse head and shoulders pattern.
Spot rate: 205.46
Relative change: -2.50%
High: 211.39
Low: 208.01
ETH/USD daily chart
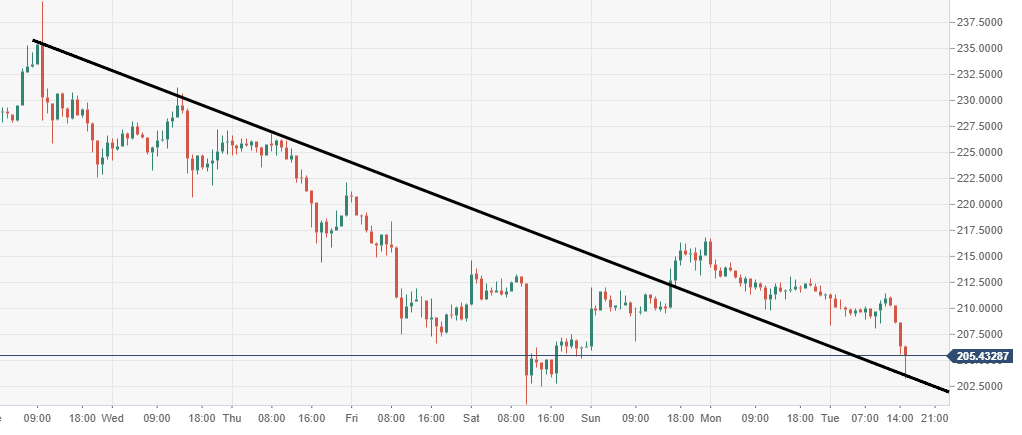
- Price action is stuck within a bearish pennant structure, subject to a breakout.
ETH/USD 60-minute chart
- Buyers are trying to protect the psychological $200, which remains vulnerable.