- Ethereum price is trading in the red by some 0.35% in the session on Friday.
- ETH/USD price action continues to move within a bearish nature, forming technical patterns for moves south.
- The next major level to the downside eyed down at the psychological $100 price mark.
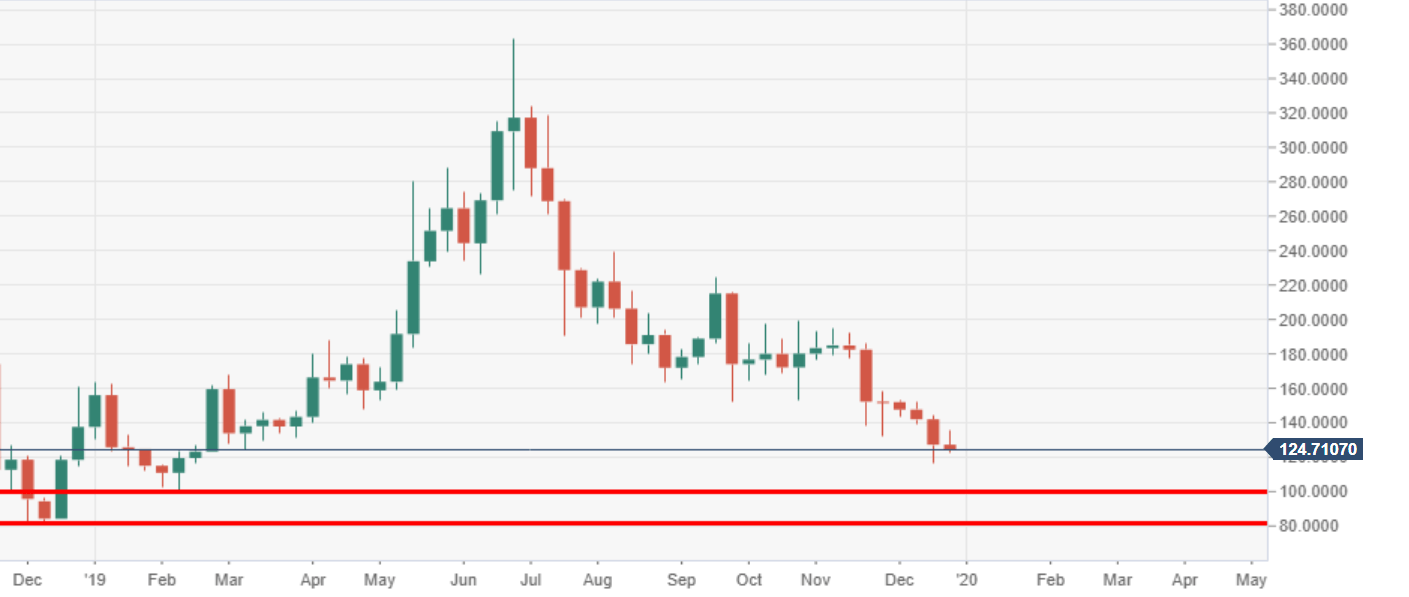
ETH/USD weekly chart
ETH/USD is running towards its seventh consecutive week in the red. The next major support areas to the downside are eyed at $100 and then $80 via the weekly.
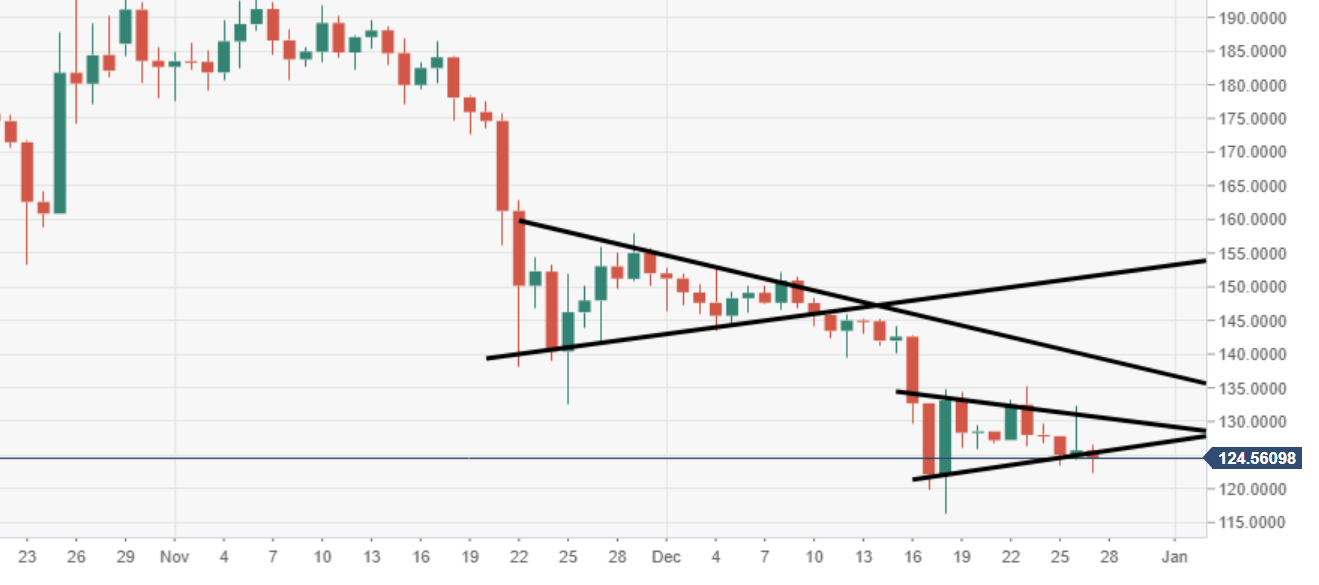
ETH/USD daily chart
Price action is moving within another bearish pennant pattern via the daily, subject to a potential breakout south.
Spot rate: 124.75
Relative change: -0.40%
High: 126.55
Low: 122.32
