- Ethereum price in the second half of Tuesday has rebounded after a soft session on Monday, holding gains of 2.50%.
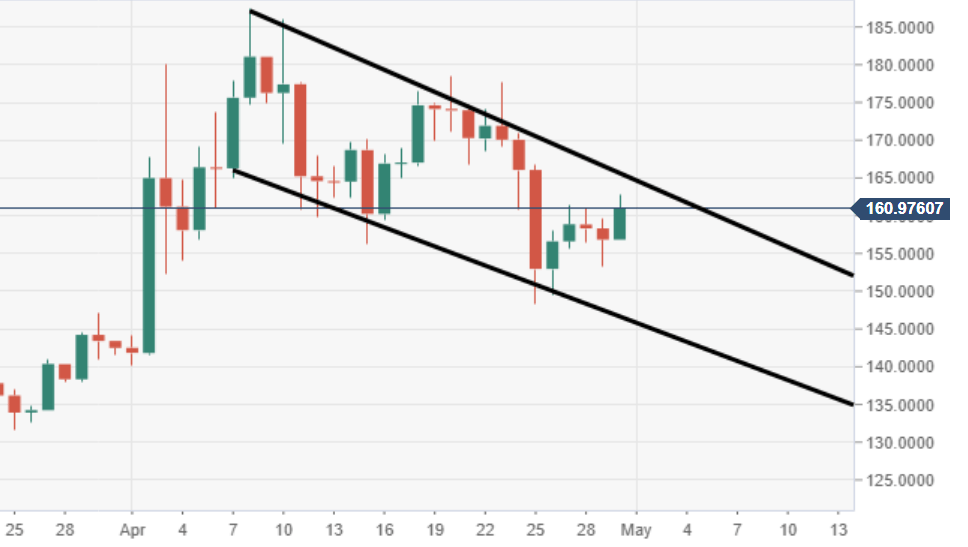
- ETH/USD daily chart view sees a bullish flag formation, subject to a breakout.
- Should the bulls manage to capitalize on the technical flag structure, eyes will be on another attempt at reclaiming $200.
Spot rate: 160.92
Relative change: +2.52%
High: 162.84
Low: 156.81
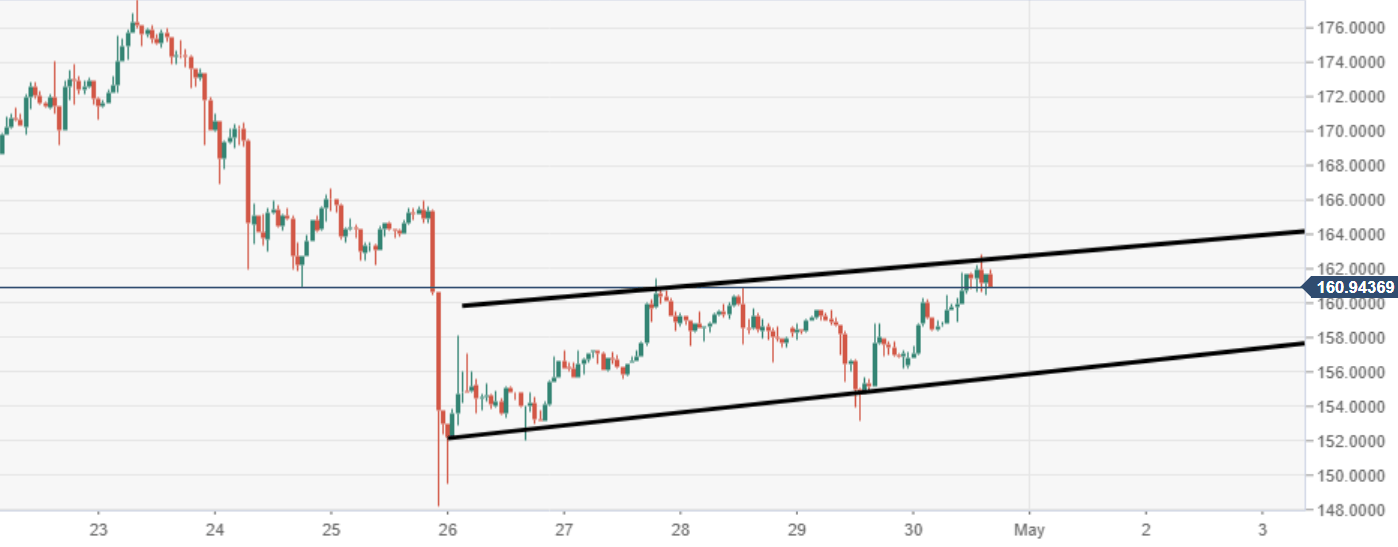
ETH/USD 60-minute chart
- The price is moving within a horizontal channel, which could be viewed as a bearish flag, somewhat contradictory on the daily set up.
ETH/USD daily chart
- Price action is moving within a bullish flag structure, subject to a breakout via the daily view.