- Ethereum price is trading in the green, up 4.00% the session on Friday.
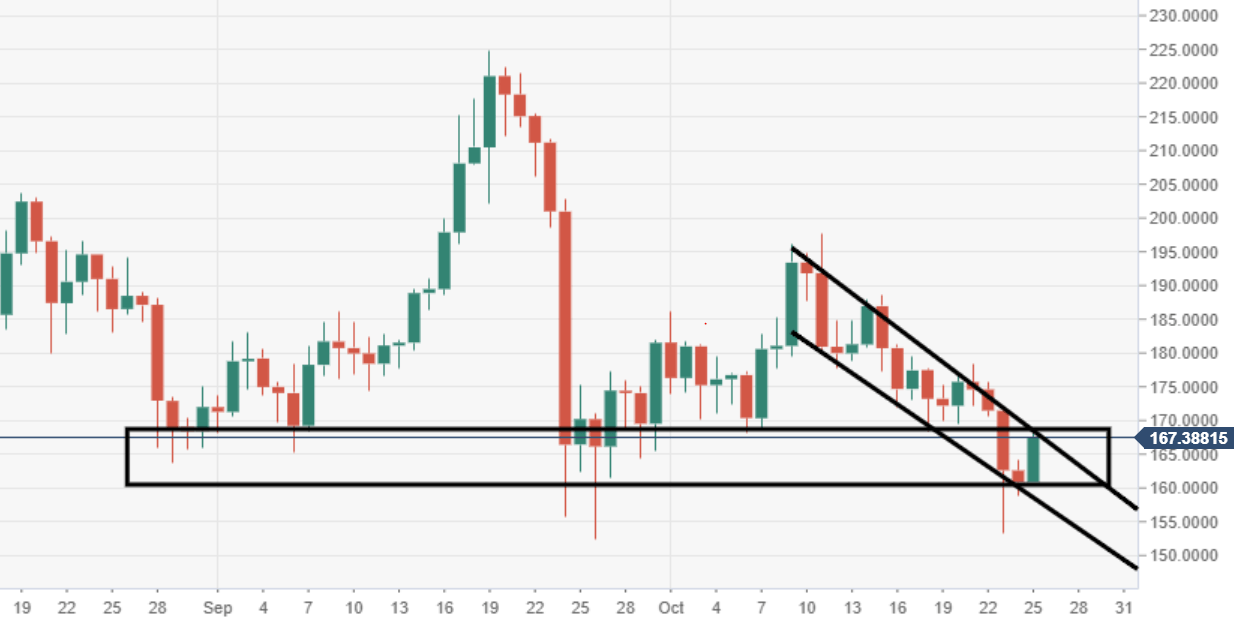
- ETH/USD has managed to receive support within a big demand area at $160 territory.
- Price action is attempting to break out from a descending wedge structure.
ETH/USD daily chart
The price had been falling within a steep downward trend between 10-24 October, which has seen the formation of a descending wedge/flag structure.
ETH/USD 60-minute chart
Near-term supply can be seen heading into the $170 price region, which is a barrier for the bulls.
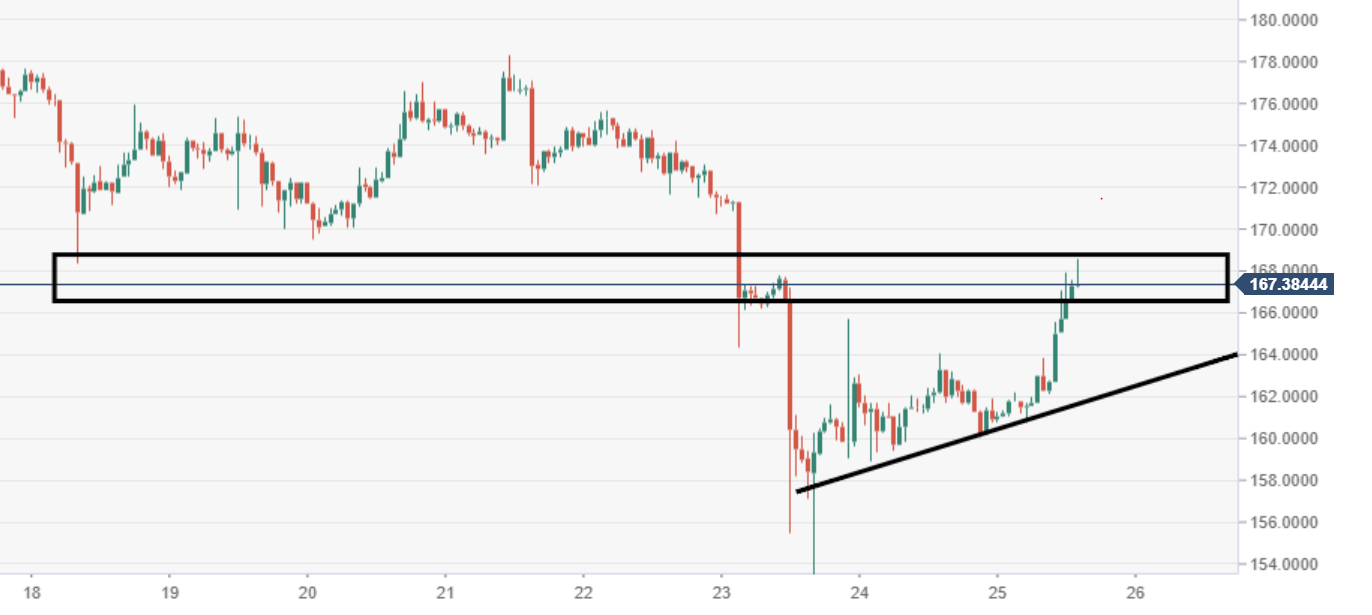
Spot rate: 167.35
Relative change: +4.00%
High: 168.60
Low: 160.78
