- Ethereum price on Wednesday is trading in the red within the second part of the session, down over 3%.
- ETH/USD continues to move within a bullish pennant pattern, lower support of pattern is holding.
- The lower trend line of the pennant can be seen tracking at $162, a breakout would likely trigger some hard selling.
Spot rate: 164.95
Relative change: -3.15%
High: 171.02
Low: 161.97
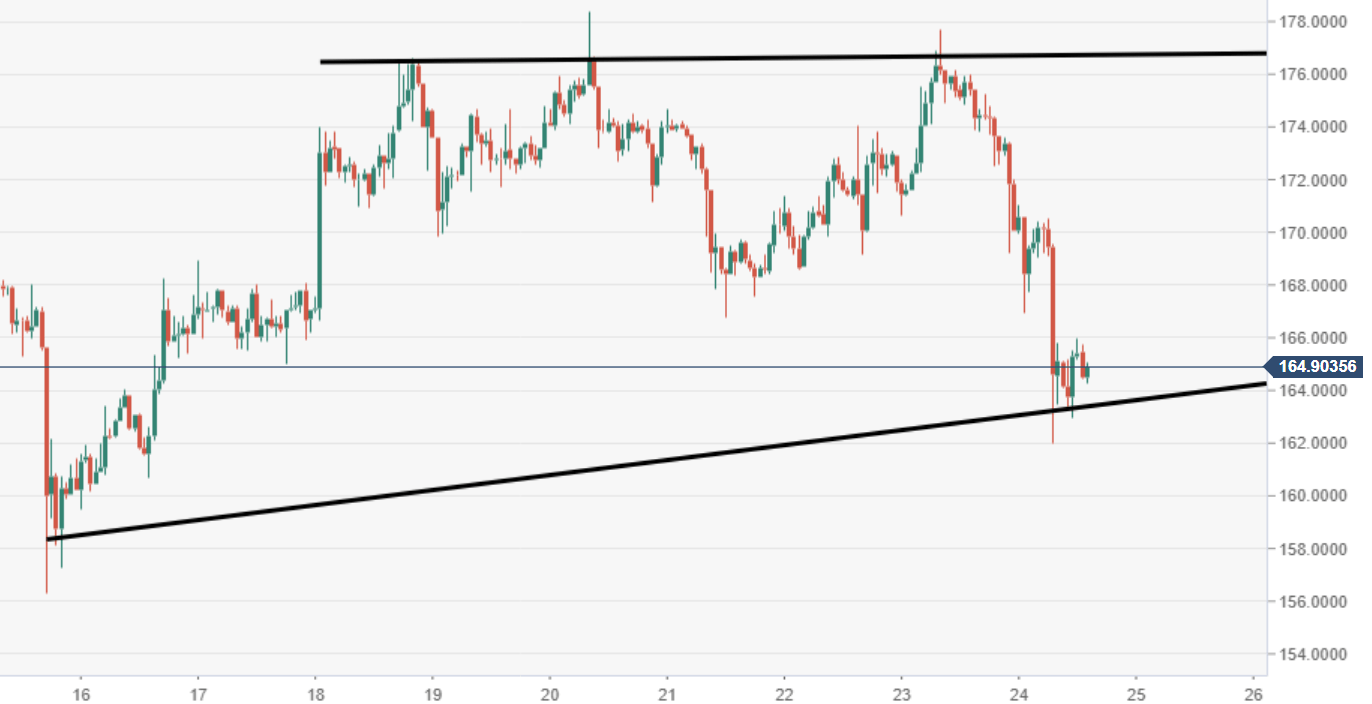
ETH/USD 60-minute chart
- ETH/USD is moving within the confinements of a horizontal wedge seen via the 60-minute view, in line with the price remaining in consolidation mode at present.
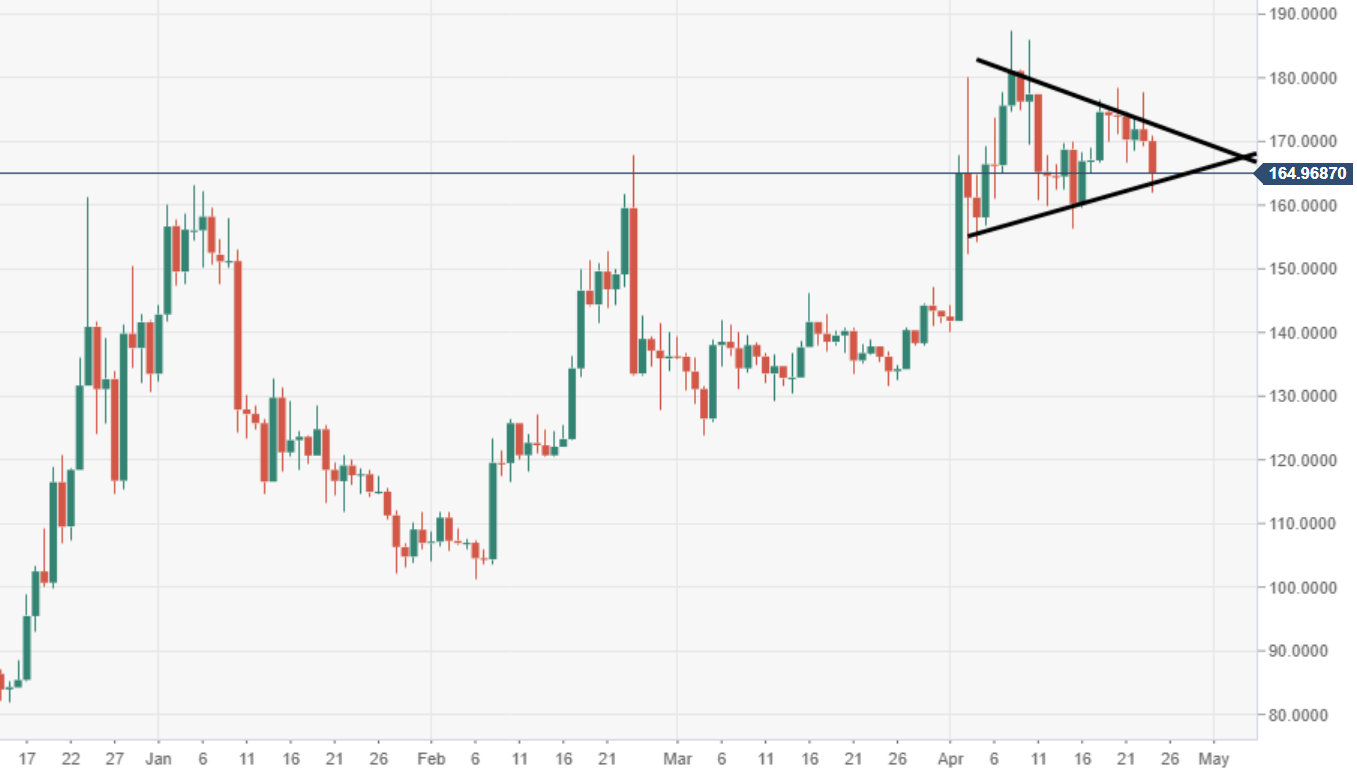
ETH/USD daily chart
- Price action is moving within a bullish pennant pattern formation, subject to a breakout.