- Ethereum price holding gains of some 1.70% in the second half of trading on Thursday.
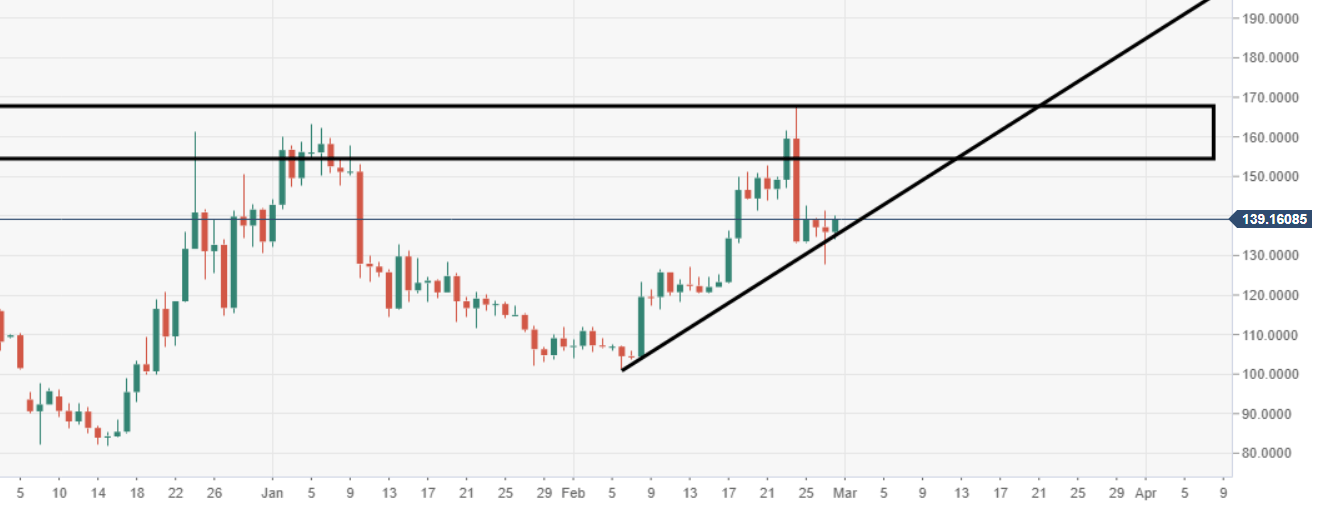
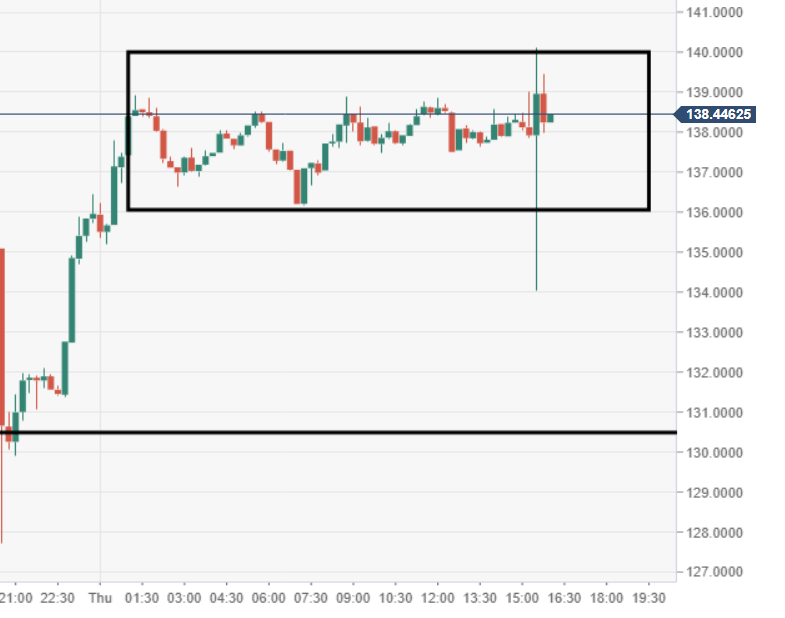
- ETH/USD mixed picture at the moment; 60-minute view shows a bearish flag formation, daily is supported by an ascending trend line, for a retest of 2019 high area.
ETH/USD 15-minute chart
![]()
Spot rate: 0.3150
Relative change: +0.70%
High: 0.3179
Low: 0.3101
Trend: Bearish
Trends:
Daily SMA20: 133.62
Daily SMA50: 123.41
Daily SMA100: 121.77
Daily SMA200: 176.43
Levels:
Previous Daily High: 141.38
Previous Daily Low: 127.73
Previous Weekly High: 152.82
Previous Weekly Low: 123.04
Previous Monthly High: 163.23
Previous Monthly Low: 102.17
Daily Fibonacci 38.2%: 132.95
Daily Fibonacci 61.8%: 136.16
Daily Pivot Point S1: 128.67
Daily Pivot Point S2: 121.38
Daily Pivot Point S3: 115.02
Daily Pivot Point R1: 142.31
Daily Pivot Point R2: 148.66
Daily Pivot Point R3: 155.95
ETH/USD 60-minute chart
- Price action has formed a moving within a bearish flag formation, seen via the 60-minute view.
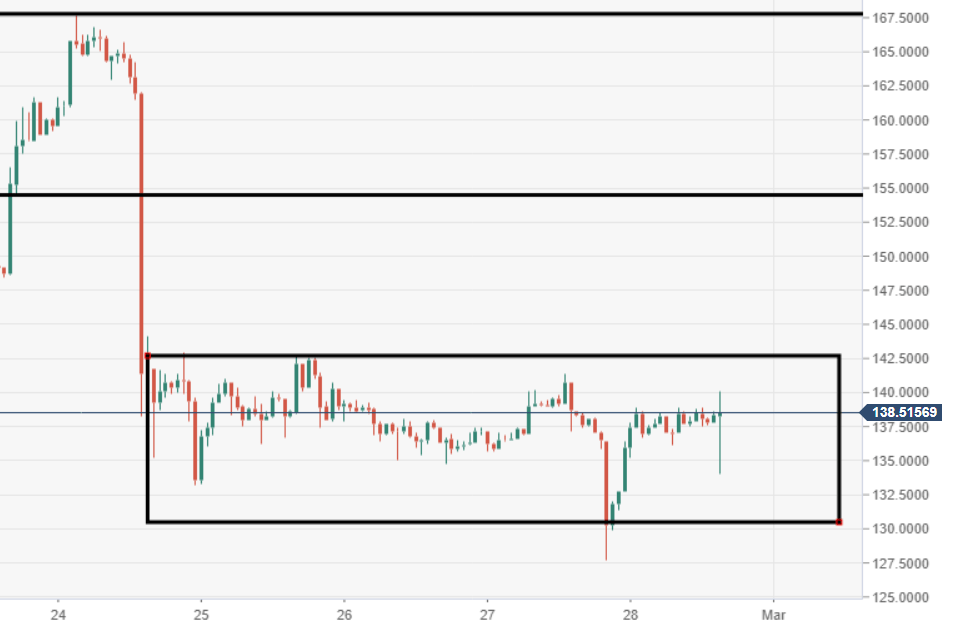
ETH/USD daily chart
- Bulls gunning for a retest of 2019 high area, supply zone tracks from $150-170 region.