- Ethereum price is trading in the red, down over 2.5% the second part of the session on Tuesday.
- ETH/USD bears are testing a critical ascending trend line of support.
- The price is remains stuck within a bearish trend, following a strong May-June.
Spot rate: 211.50
Relative change: -2.60%
High: 217.29
Low: 208.47
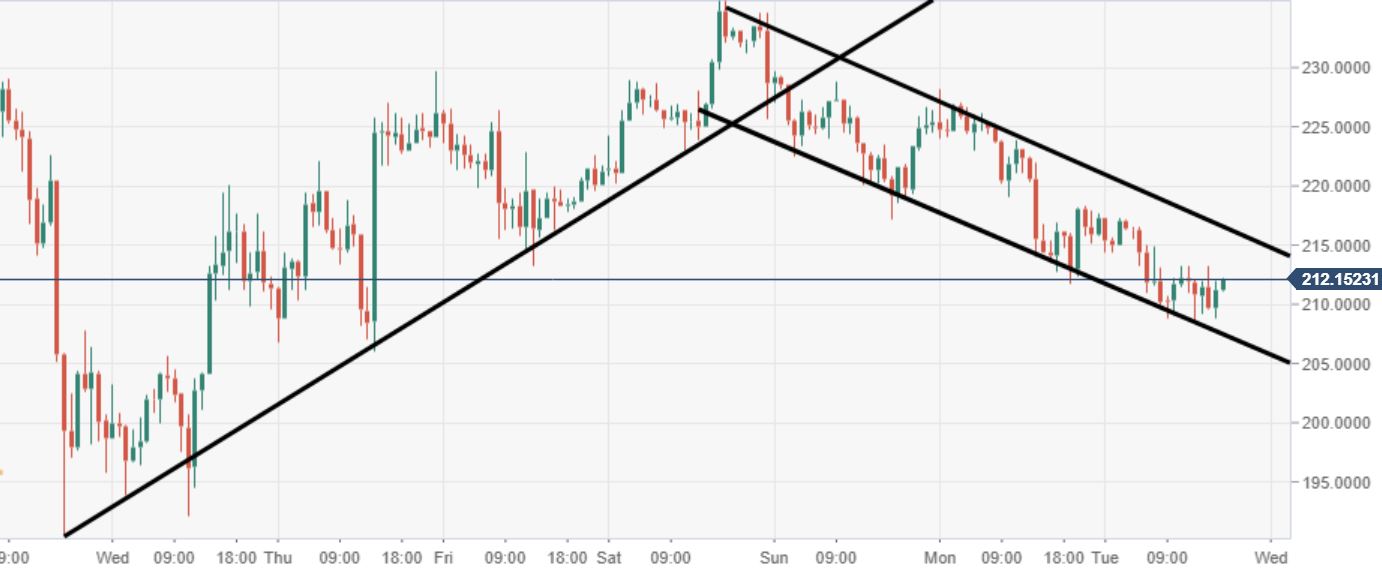
ETH/USD 60-minute chart
- Since the bears forced a critical near-term ascending trend line breakout via the 60-minute, ETH/USD has been sucked within a descending channel to the south.
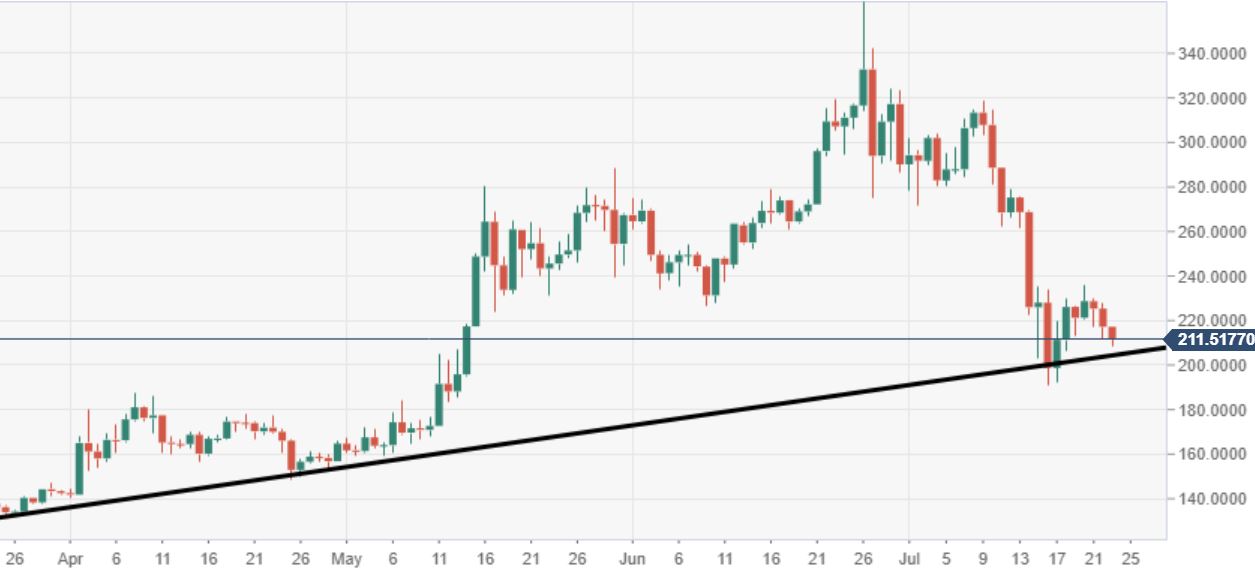
ETH/USD daily chart
- Big trend line test is being seen by the bears, a breach could invite another strong wave of selling.