- Ethereum price is trading marginally in the red, down 1.60% the session on Monday.
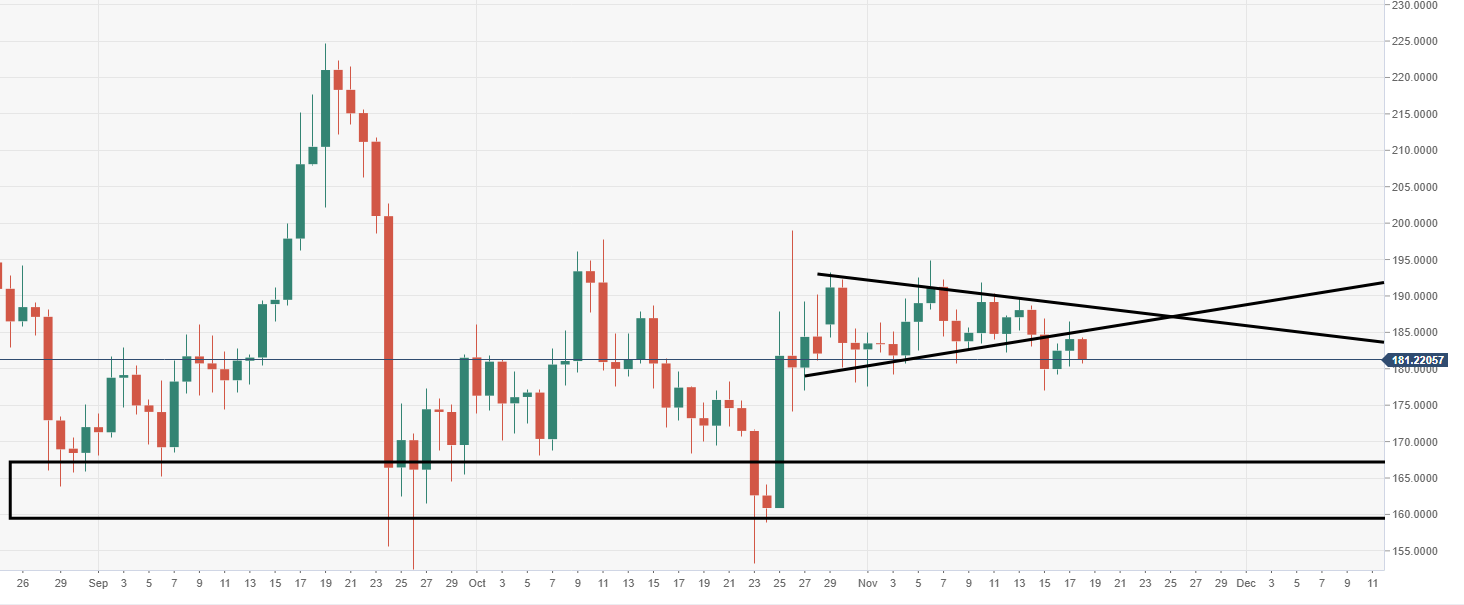
- ETH/USD bears have broken out to the downside from a daily narrowing triangular structure.
- Next major support to the downside is eyed down at $165-160 range.
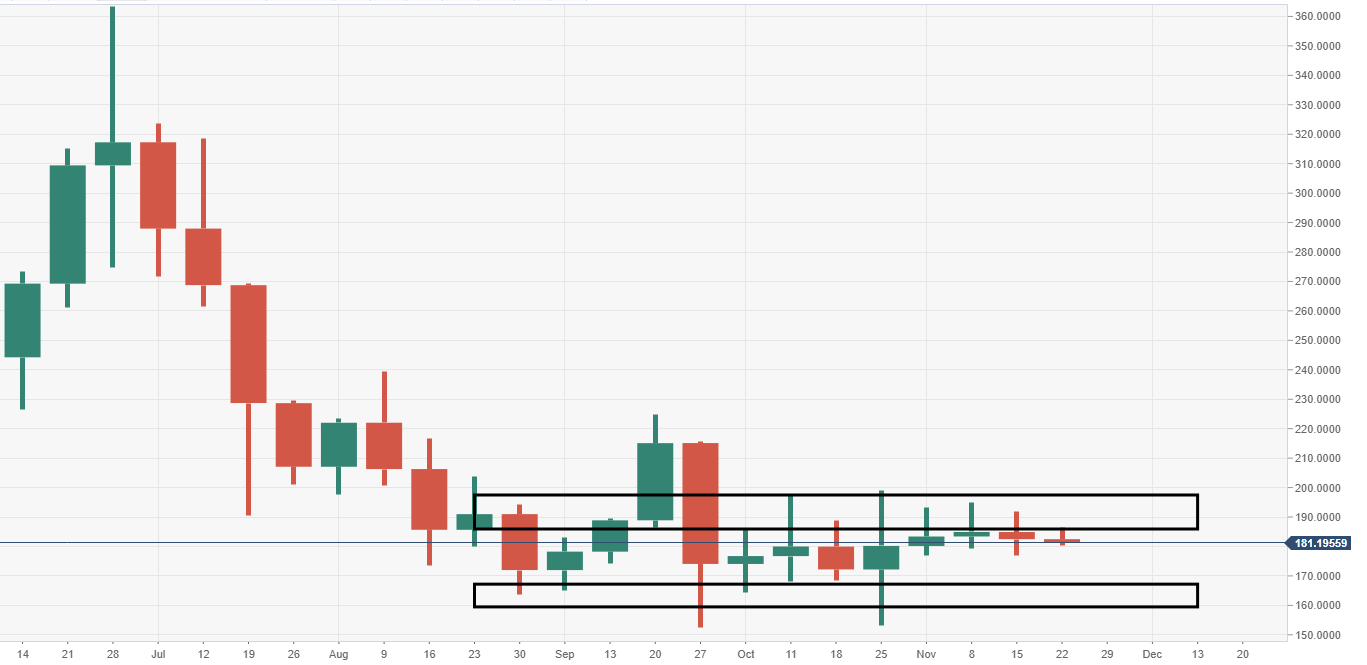
ETH/USD weekly chart
Price action via the weekly has done little since late August, tight trading conditions.
ETH/USD daily chart
A breakout of a three-week range is eyed given the triangular breach via the daily.
Spot rate: 181.21
Relative change: -1.55%
High: 184.23
Low: 180.69
