- Ethereum price late on Wednesday was trading down with minor losses of some 0.50% in the second half.
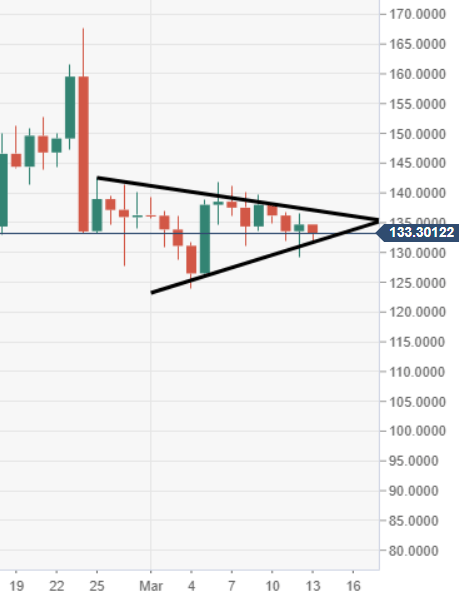
- ETH/USD price action via the daily chart view is moving within a bearish pennant pattern.
- Near-term descending channel formation eyed via the 60-minute chart view.
Spot rate: 133.24
Relative change: -0.55%
High: 134.76
Low: 131.64
Trends:
Daily SMA20: 137.8
Daily SMA50: 125.97
Daily SMA100: 122.89
Daily SMA200: 166.04
Levels:
Previous Daily High: 136.51
Previous Daily Low: 129.2
Previous Weekly High: 141.86
Previous Weekly Low: 123.9
Previous Monthly High: 167.77
Previous Monthly Low: 101.12
Daily Fibonacci 38.2%: 133.72
Daily Fibonacci 61.8%: 131.99
Daily Pivot Point S1: 130.43
Daily Pivot Point S2: 126.16
Daily Pivot Point S3: 123.12
Daily Pivot Point R1: 137.75
Daily Pivot Point R2: 140.79
Daily Pivot Point R3: 145.06
ETH/USD 60-minute chart
- Price action moving within a descending channel formation via the 60-minute chart view.
- Bulls faced rejection at resistance by the upper acting trend line of the descending channel.

ETH/USD daily chart
- ETH/USD remains within the confinements of a bearish pennant pattern formation.