- Ethereum price in the second half of the session on Tuesday was trading marginally in the red, down some 0.35%.
- ETH/USD hunting for the next area of support following key breakout to the downside from an ascending formation.
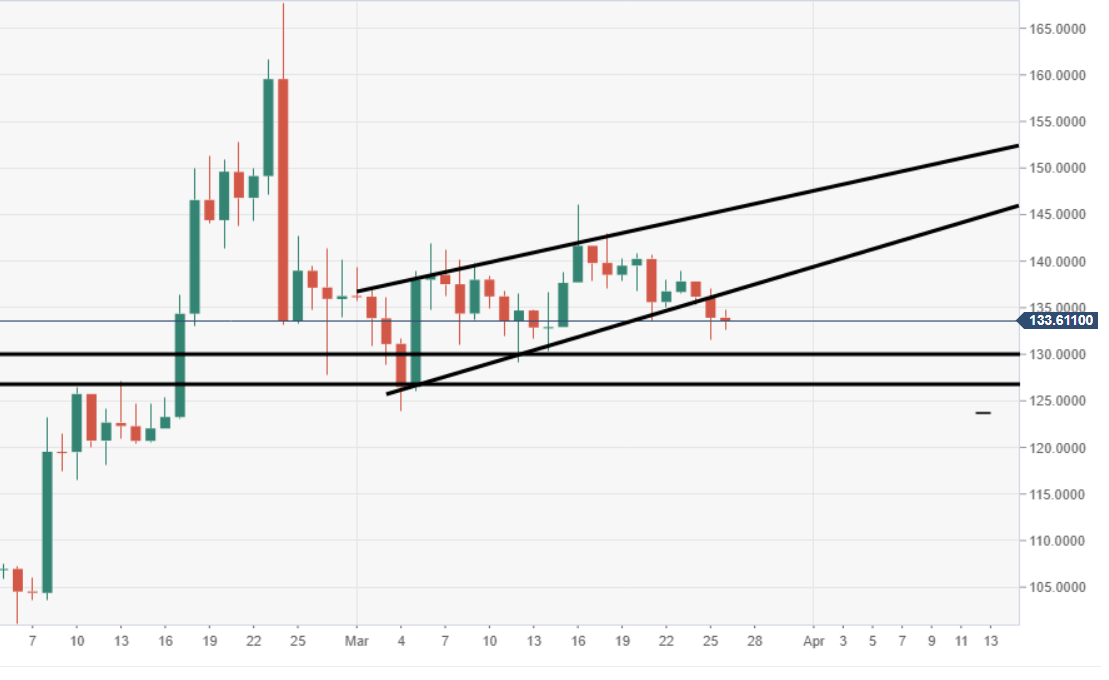
- The next major area of potential comfort is seen down at around the $130 territory.
Spot rate: 133.51
Relative change: -0.35%
High: 134.80
Low: 132.58
Trend: Bearish/Neutral
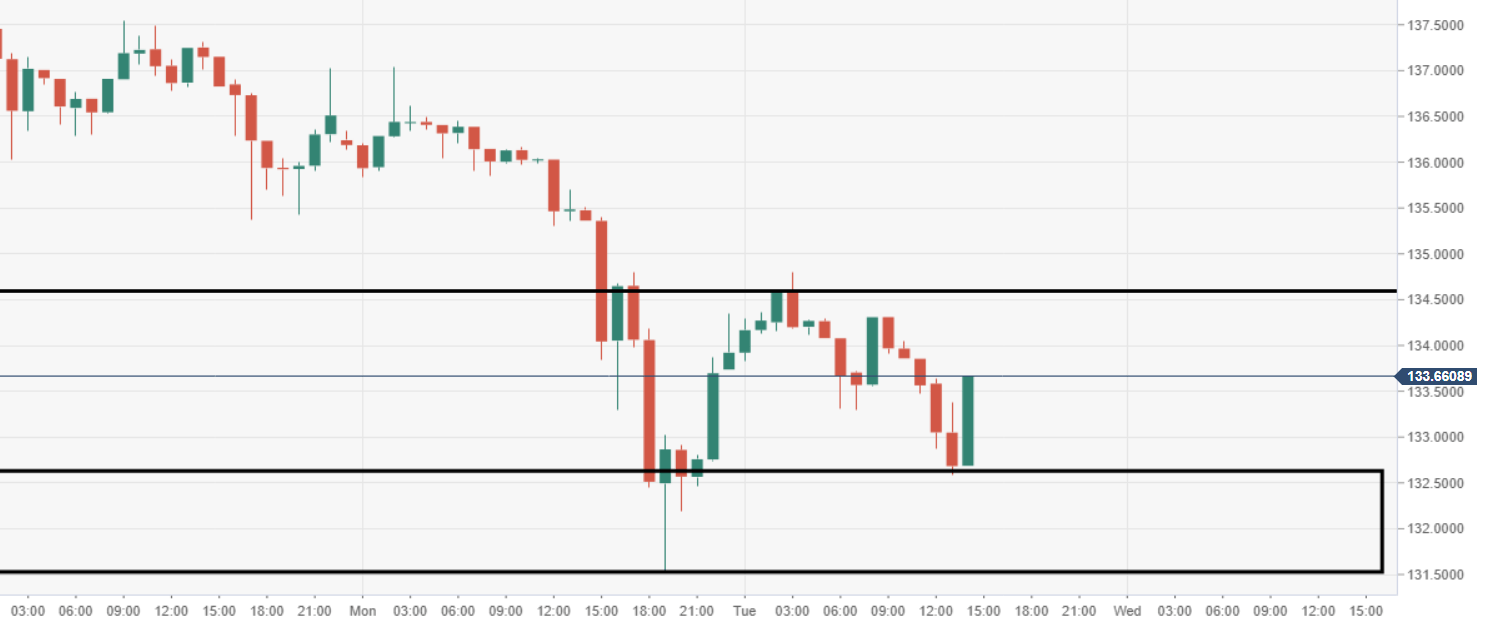
ETH/USD 60-minute chart
- Support saves price, for now, demand area running from $131-132 range.
- Price action capped to the upside by hourly resistance seen at $134.50.
ETH/USD daily chart
- Bears are gradually extending the price south, following the critical breakout of a key supporting trend line, as part of a wedge formation.