- Ethereum price is struggling on Monday, holding losses of around 1% in the session.
- ETH/USD bears are pressing towards another test of a long-running daily ascending trend line.
Spot rate: 138.54
Relative change: -0.90%
High: 142.99
Low: 137.10
Trends:
Daily SMA20: 135.95
Daily SMA50: 127.62
Daily SMA100: 123.89
Daily SMA200: 163.25
Levels:
Previous Daily High: 141.65
Previous Daily Low: 137.9
Previous Weekly High: 138.76
Previous Weekly Low: 129.2
Previous Monthly High: 167.77
Previous Monthly Low: 101.12
Daily Fibonacci 38.2%: 139.33
Daily Fibonacci 61.8%: 140.22
Daily Pivot Point S1: 137.91
Daily Pivot Point S2: 136.03
Daily Pivot Point S3: 134.16
Daily Pivot Point R1: 141.67
Daily Pivot Point R2: 143.54
Daily Pivot Point R3: 145.42
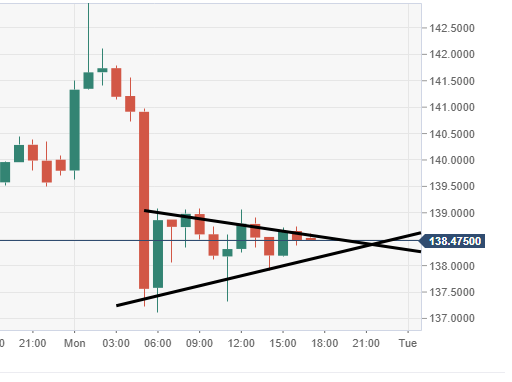
ETH/USD 60-minute chart
- Near-term price action has formed a bearish pennant pattern formation, subject to potential breakout south.
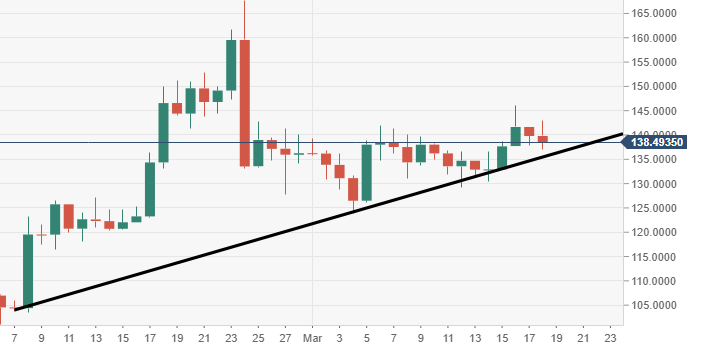
ETH/USD daily chart
- The key ascending trend line has been running since 8th February, a breach could be punishing.
- If the above-noted fails to hold, there could be a retest of the $100 mark to the downside.