Home Ethereum Technical Analysis: ETH/USD jumps over 5%, as price breaks out above a descending trend line
Crypto News

Ethereum Technical Analysis: ETH/USD jumps over 5%, as price breaks out above a descending trend line

  • Ethereum was seen up almost 5% on Monday, after starting the session very slow, within negative territory.
  • ETH/USD manages to take a jump back above the $500 mark.
  • Resistance seen around $525, could cause some problems for the bulls attempt to build on momentum.


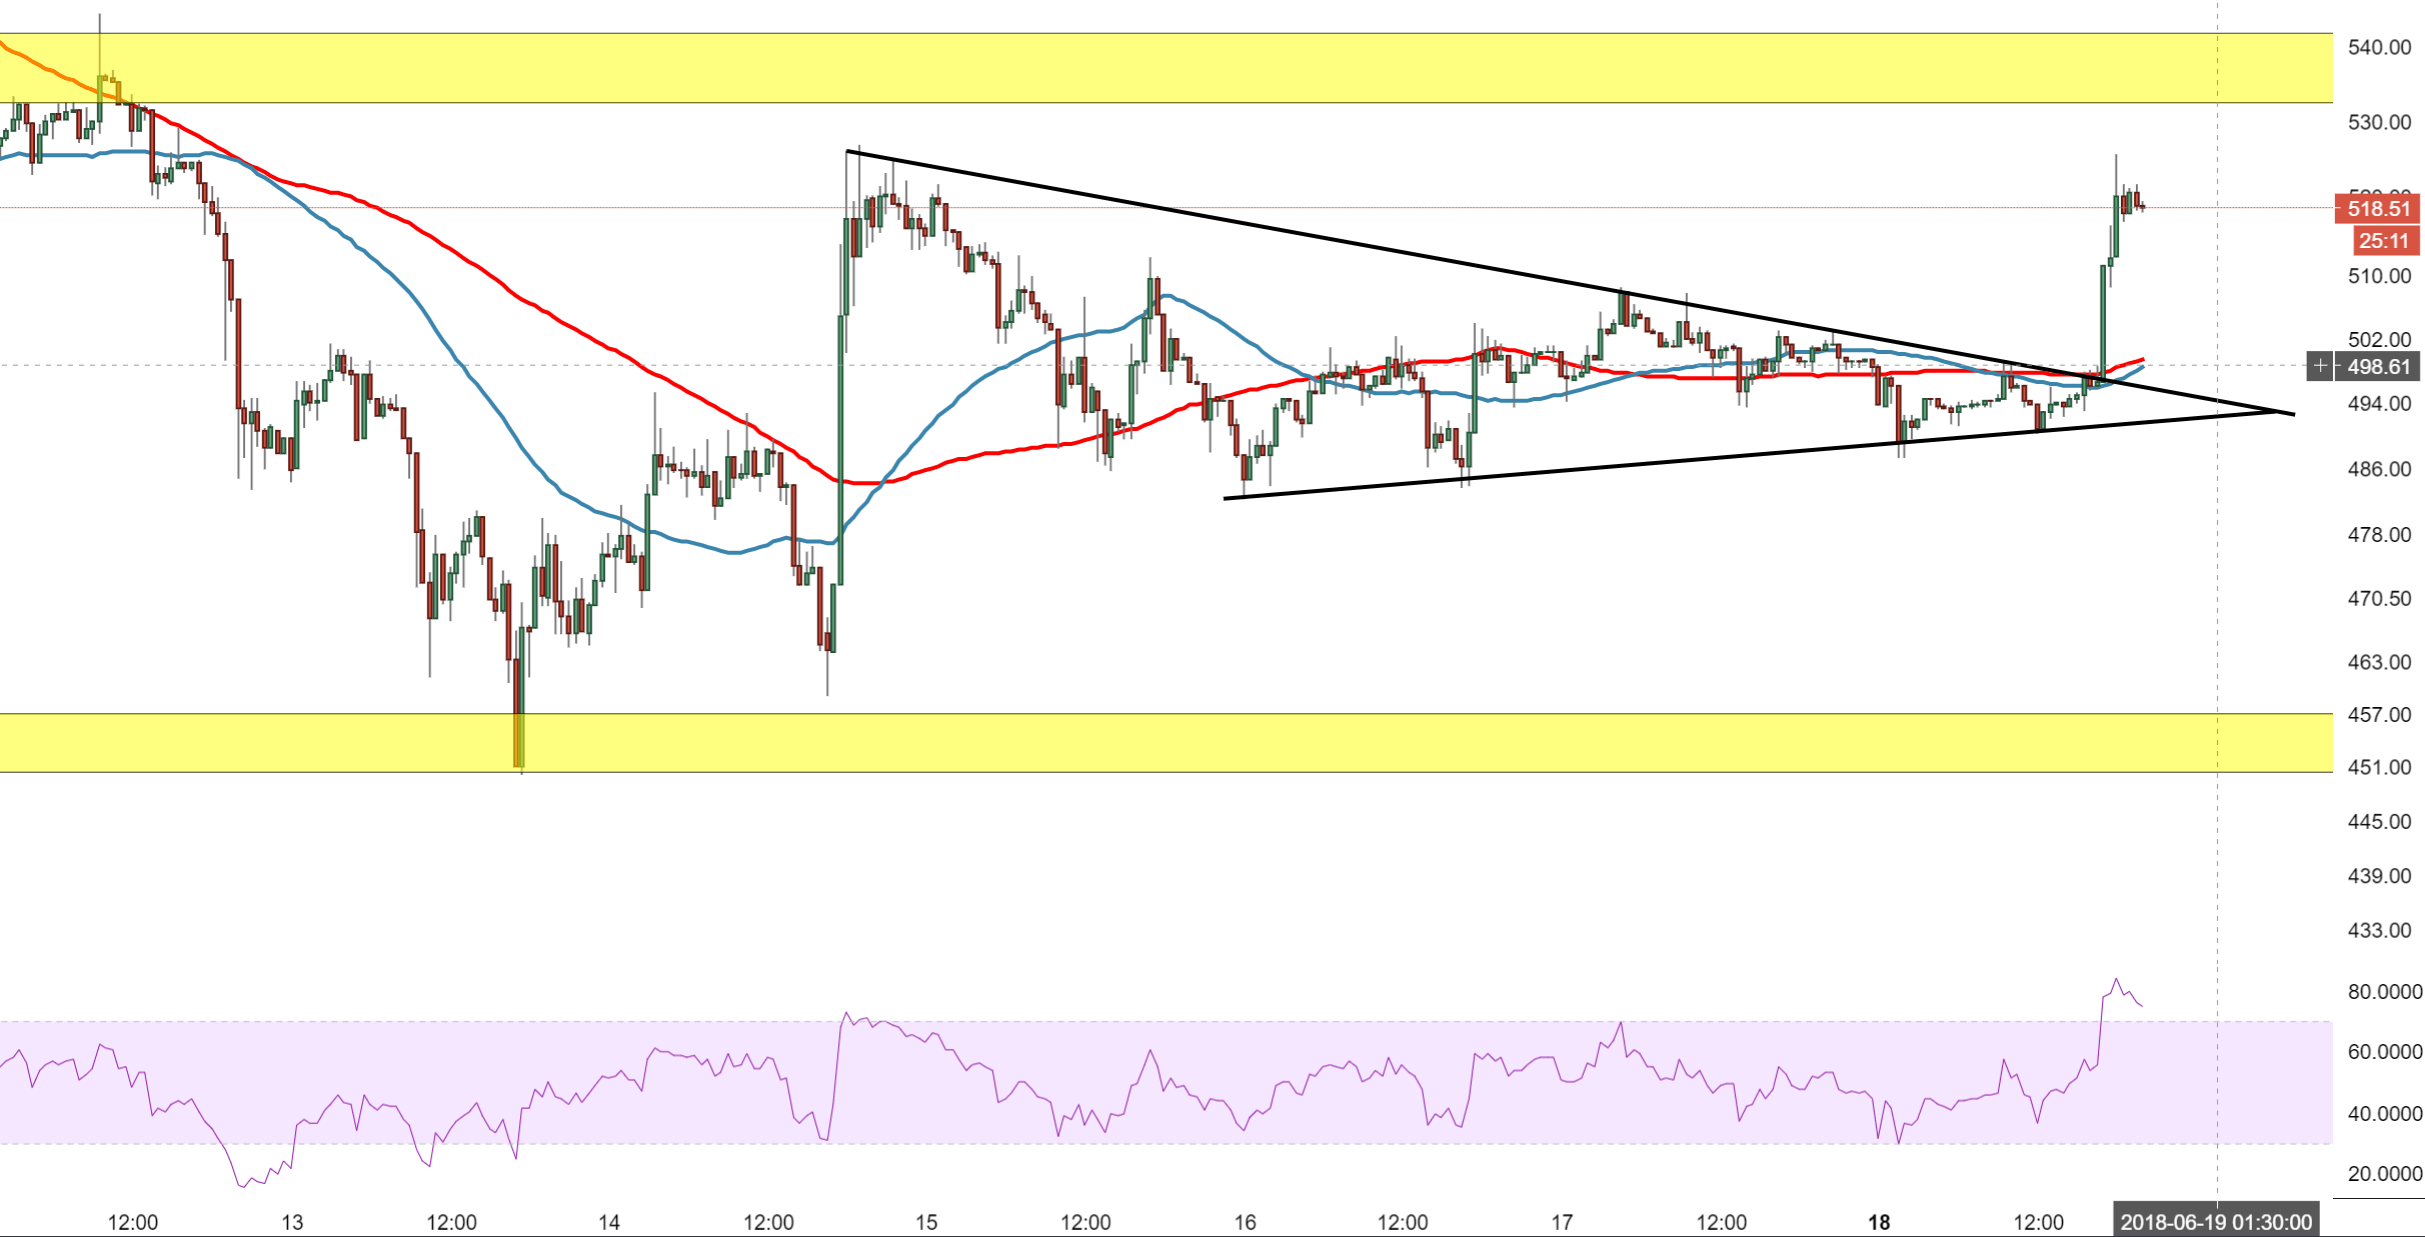
ETH/USD 30-minute chart


Spot rate:                                     6224.90

Relative change:               – 4.95%

High:                                                   6611.70

Low:                                                       6107.90


Trend:                                                 Bullish


Resistance 1:                           525.00, 14th June highs & (support on 60-minute).

Resistance 2:                           532.70, supply zone entry.

Resistance 3:                           543.90, 12th June high.

Support 1:                                  498.29, 50 / 100 MAs.

Support 2:                                    495.00, above descending trend line.

Support 3:                                    490.88, lower tracking ascending trend line.


FX Street

FX Street

FXStreet is the leading independent portal dedicated to the Foreign Exchange (Forex) market. It was launched in 2000 and the portal has always been proud of their unyielding commitment to provide objective and unbiased information, to enable their users to take better and more confident decisions.