Home Ethereum Technical Analysis: ETH/USD makes a late attempt on Friday to recover some losses, as price jumps out of bull flag pattern
Crypto News

Ethereum Technical Analysis: ETH/USD makes a late attempt on Friday to recover some losses, as price jumps out of bull flag pattern

  • Ethereum hit on Friday, nursing losses of over 3%, with what continued to be a bearish week.
  • ETH/USD price cooled during the session, after the large surge seen on Thursday, but price action had been forming a bullish flag pattern.
  • Soft sentiment across the crypto market, has most likely added to some of the selling pressure seen.


ETH/USD 30-minute chart
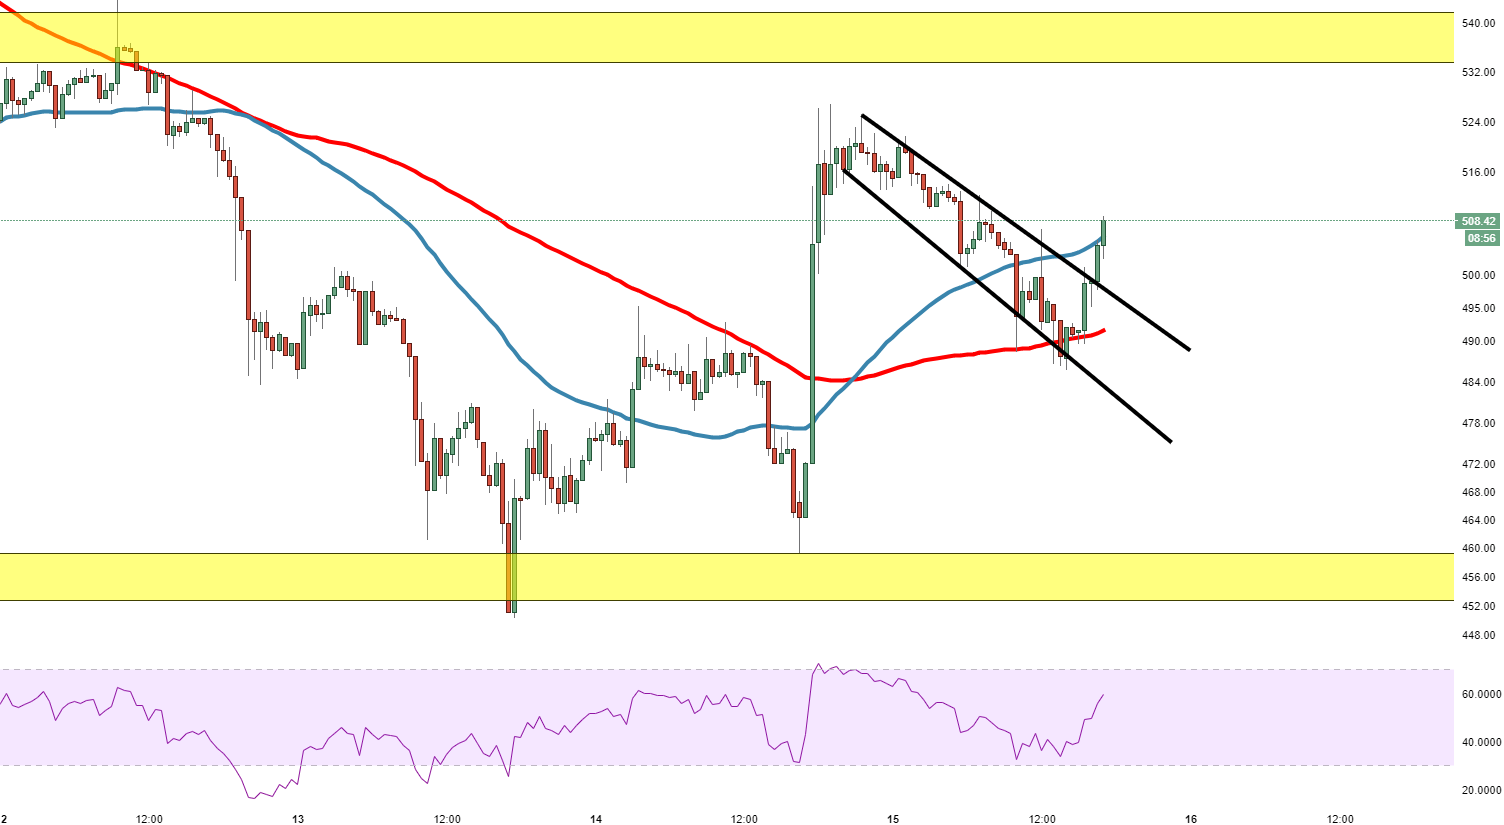
Spot rate:                                     502.89

Relative change:               -3.25%

High:                                                       521.62

Low:                                                       485.51


Trend:                                                   Bearish


Support 1:                                 497.90, top of bull flag.

Support 2:                                   491.70, 100MA.

Support 3:                                   483.81, lower trend line of bull flag.

Resistance 1:                        506.50, 50MA.

Resistance 2:                        526.52, (resistance on 30-minute chart).    

Resistance 3:                        533.00, supply zone.


FX Street

FX Street

FXStreet is the leading independent portal dedicated to the Foreign Exchange (Forex) market. It was launched in 2000 and the portal has always been proud of their unyielding commitment to provide objective and unbiased information, to enable their users to take better and more confident decisions.