Home Ethereum Technical Analysis: ETH/USD makes a strong surge through a descending wedge pattern, as bears downside move runs dry for now
Crypto News

Ethereum Technical Analysis: ETH/USD makes a strong surge through a descending wedge pattern, as bears downside move runs dry for now

  • Ethereum price was seen holding modest gains just shy of 1% on Friday, after going through a punishing week of selling.
  • ETH/USD breaks out of a descending wedge pattern, playing to the text book with the move through.  


ETH/USD 30-minute chart
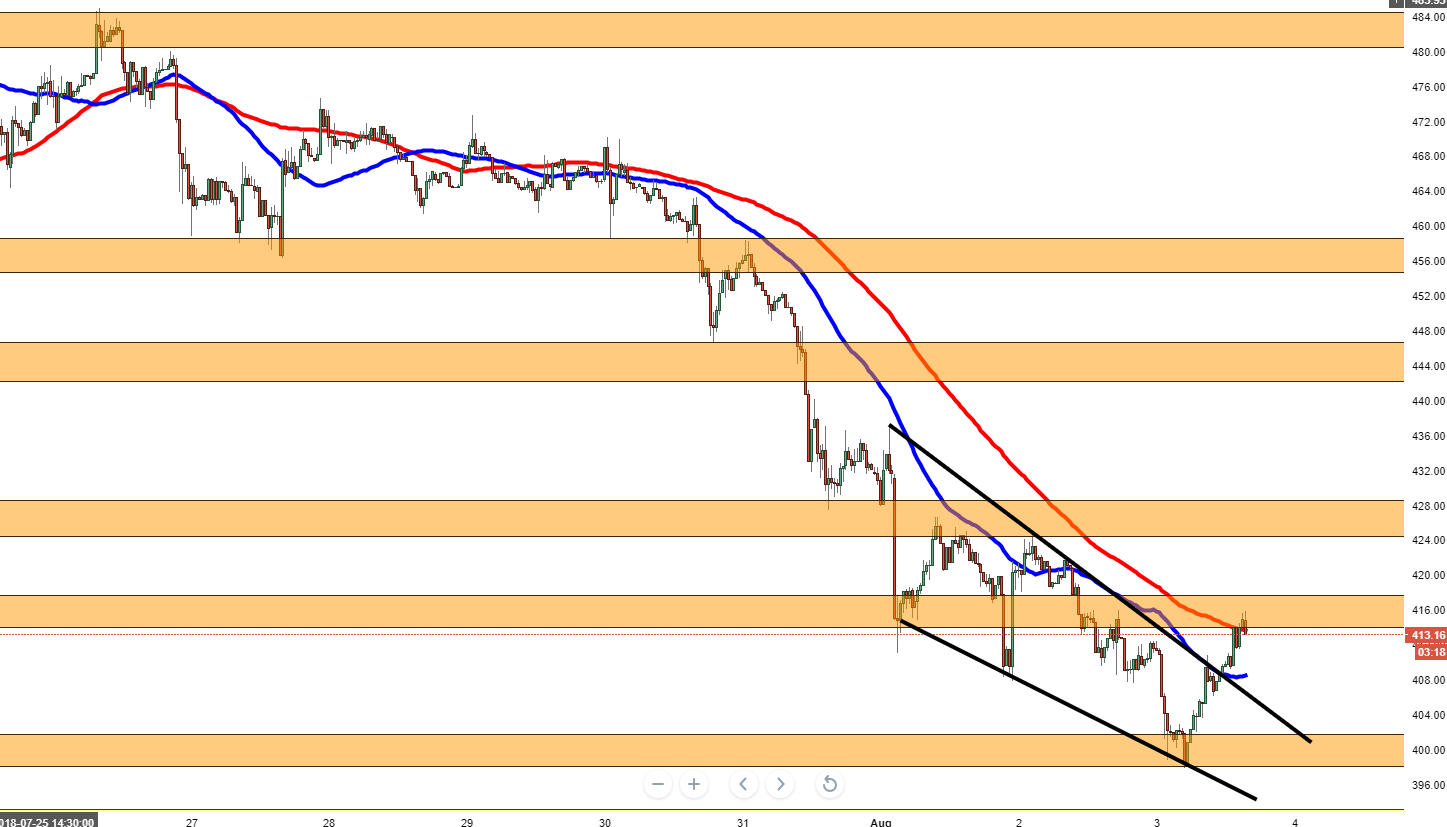


Spot rate:                    413.43

Relative change:        +2.01%

High:                          415.78

Low:                           397.84

Trend:                         Neutral


Support 1:                  413.17, 100MA.

Support 2:                  408.58, 50MA.

Support 3:                  407.09, above broken wedge pattern.

Resistance 1:             415.80,  (resistance on 30-minute chart), strong top area.

Resistance 2:             416.00, new supply area.

Resistance 3:             424.18, 2nd August high and supply zone.  


FX Street

FX Street

FXStreet is the leading independent portal dedicated to the Foreign Exchange (Forex) market. It was launched in 2000 and the portal has always been proud of their unyielding commitment to provide objective and unbiased information, to enable their users to take better and more confident decisions.