- Ethereum price hard hit on Tuesday, nursing losses of just shy 3% towards latter stages of session.
- ETH/USD is moving within a bearish pennant structure, subject to an extended move south.
- Bears are currently flirting with lower support of the mentioned pennant pattern.
- Social media space continues to have a sense of nervous anticipation heading into the Constantinople upgrade, mid Jan 2019.
ETH/USD 4-hour chart
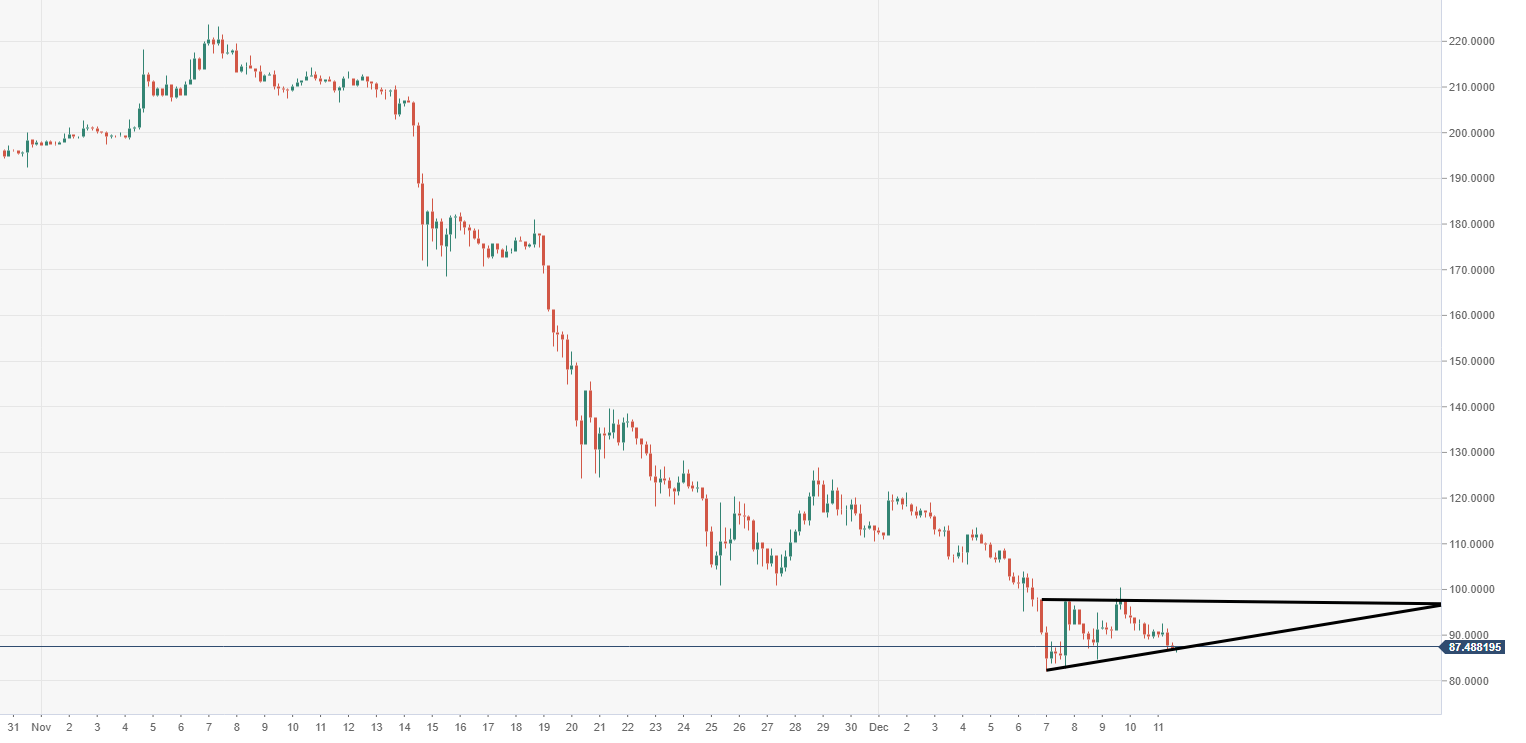
Spot rate: 87.50
Relative change: -3.80%
High: 92.52
Low: 86.19
Trend: Bearish
Support 1: 86.10, lower support of pennant.
Support 2: 84.80, daily pivot point support.
Support 3: 80.57, daily pivot point support.
Resistance 1: 94.93, daily pivot point resistance.
Resistance 2: 97.47, upper part of pennant.
Resistance 3: 99.16, daily pivot point resistance.
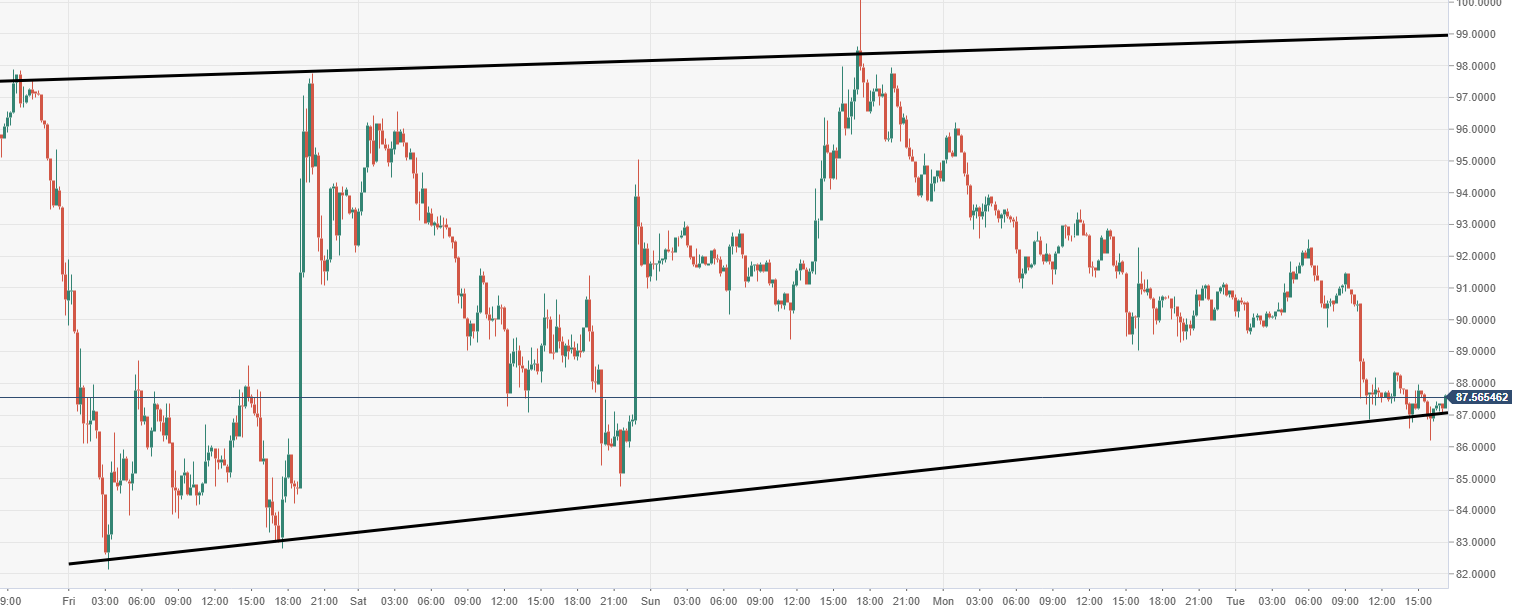
ETH/USD 60-minute chart
- Price action continues to respect the mentioned pennant pattern for now, however it can be seen how close ETH/USD is tracking to the lower support line.