- Ethereum price on Friday holding minor gains of just some 0.30% in the second half of the session.
- ETH/USD is just one barrier away from potential return back down to $100, if the bulls fail to capitalise on a decent near-term demand zone.
Spot rate: 136.73
Relative change: +0.30%
High: 137.66
Low: 135.73
Trend: Neutral/Bearish
Trends:
Daily SMA20: 134.46
Daily SMA50: 123.11
Daily SMA100: 121.36
Daily SMA200: 175.45
Levels:
Previous Daily High: 140.12
Previous Daily Low: 134.04
Previous Weekly High: 152.82
Previous Weekly Low: 123.04
Previous Monthly High: 167.77
Previous Monthly Low: 101.12
Daily Fibonacci 38.2%: 137.8
Daily Fibonacci 61.8%: 136.36
Daily Pivot Point S1: 133.49
Daily Pivot Point S2: 130.73
Daily Pivot Point S3: 127.41
Daily Pivot Point R1: 139.56
Daily Pivot Point R2: 142.88
Daily Pivot Point R3: 145.64
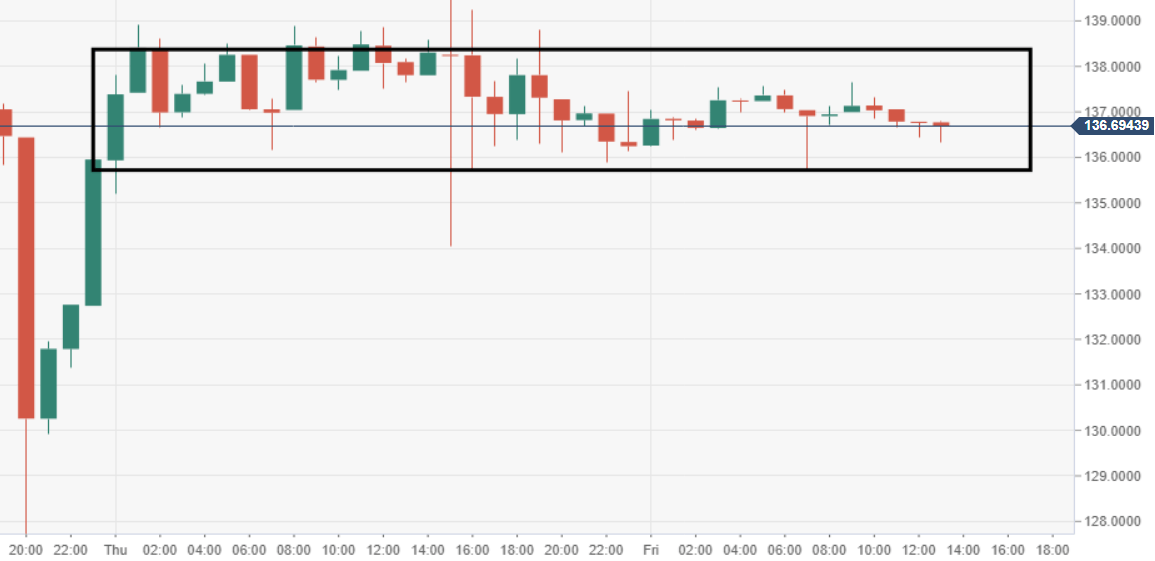
ETH/USD 60-minute chart
- The range has narrowed greatly via the 60-minute chart view, subject to a near-term breakout.
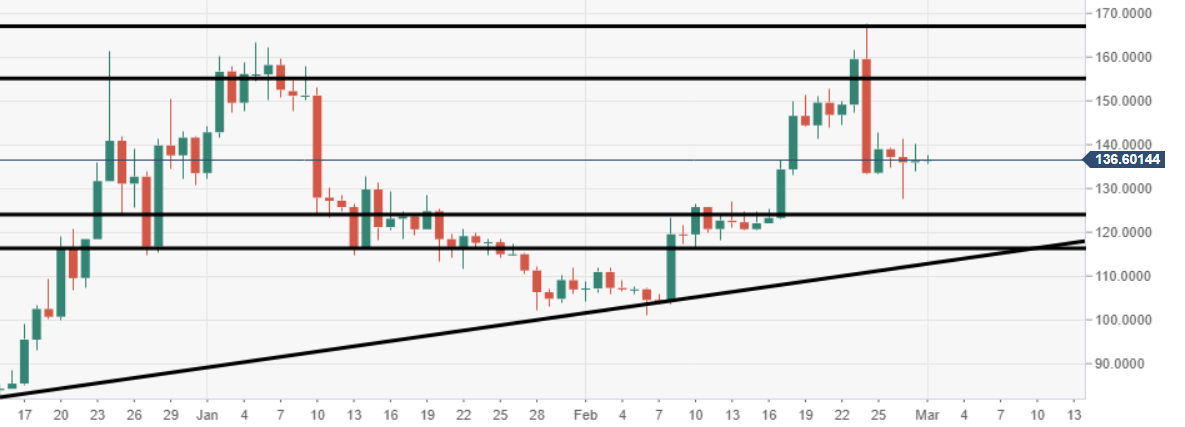
ETH/USD daily chart
- Price action remains somewhat subdued via the daily, a key demand zone should be noted from $125-115.