- Ethereum hits sessions lows at $461.00, finding support at levels seen on 18th March during period of sell-off for the month.
- ETH/USD has moved back out of the oversold territory, after seeing the RSI at around the 22 mark before seeing a bounce in the price.
- Resistance may not be seen heading back towards an initial demand zone, where the price was capped during a period of range-bound trading earlier in the week.
ETH/USD 60-minute chart
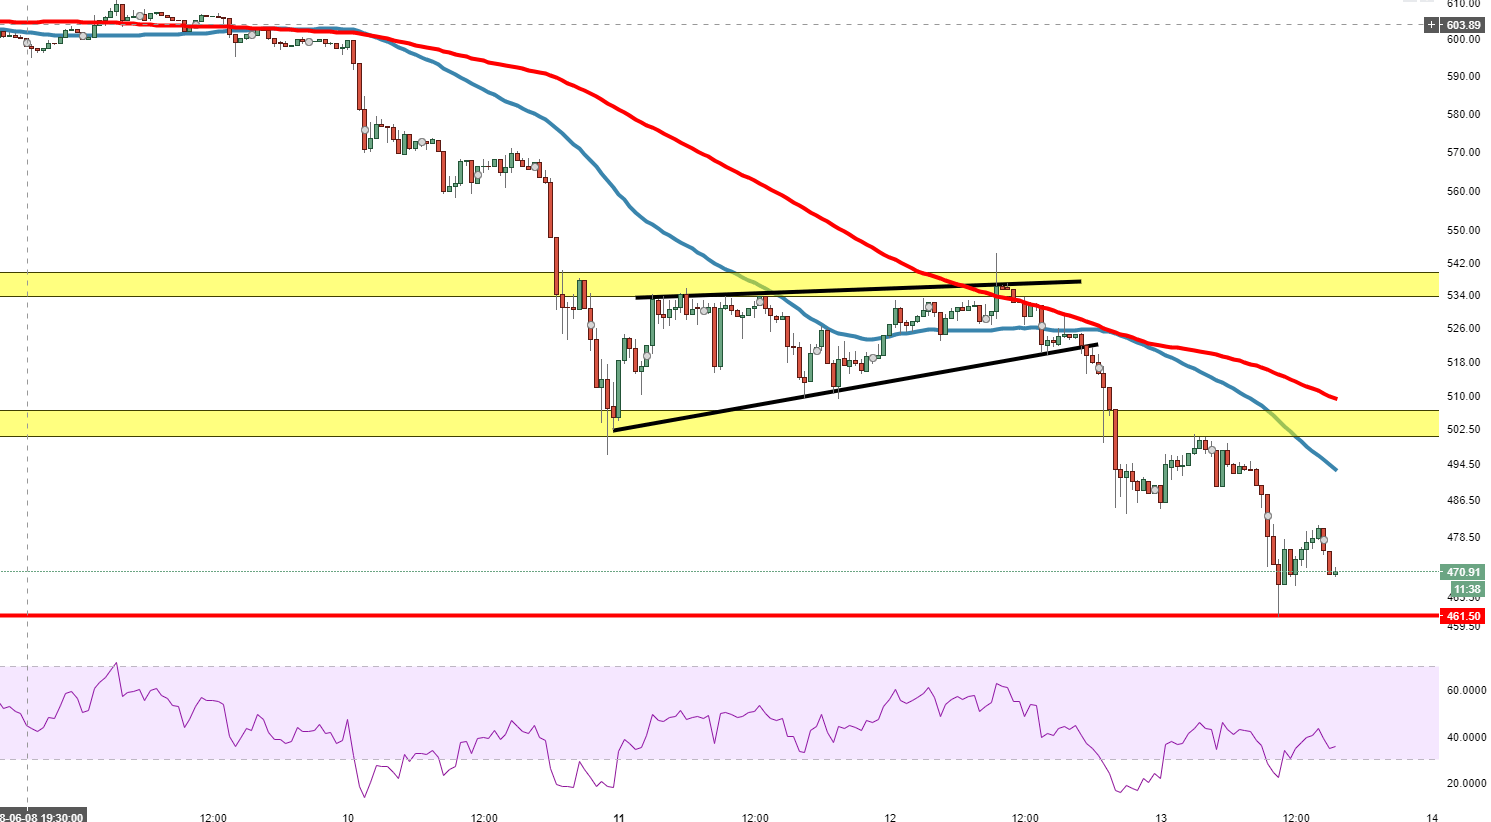
Spot rate: 471.50
Relative change: -4.60%
High: 511.11
Low: 461.00
Trend: Bearish
Support 1: 461.50, today’s (Wednesday) lows & 18th March support.
Support 2: 392.00, demand zone & 7th December lows.
Support 3: 357.00, 1st April lows.
Resistance 1: 495.90, 50MA.
Resistance 2: 505.00, previous demand zone.
Resistance 3: 511.02, 100MA.
