- Ethereum price is seen nursing minor losses just shy of 1% in the session on Monday.
- ETH/USD has formed another bearish pennant pattern with recent price action.
ETH/USD daily chart
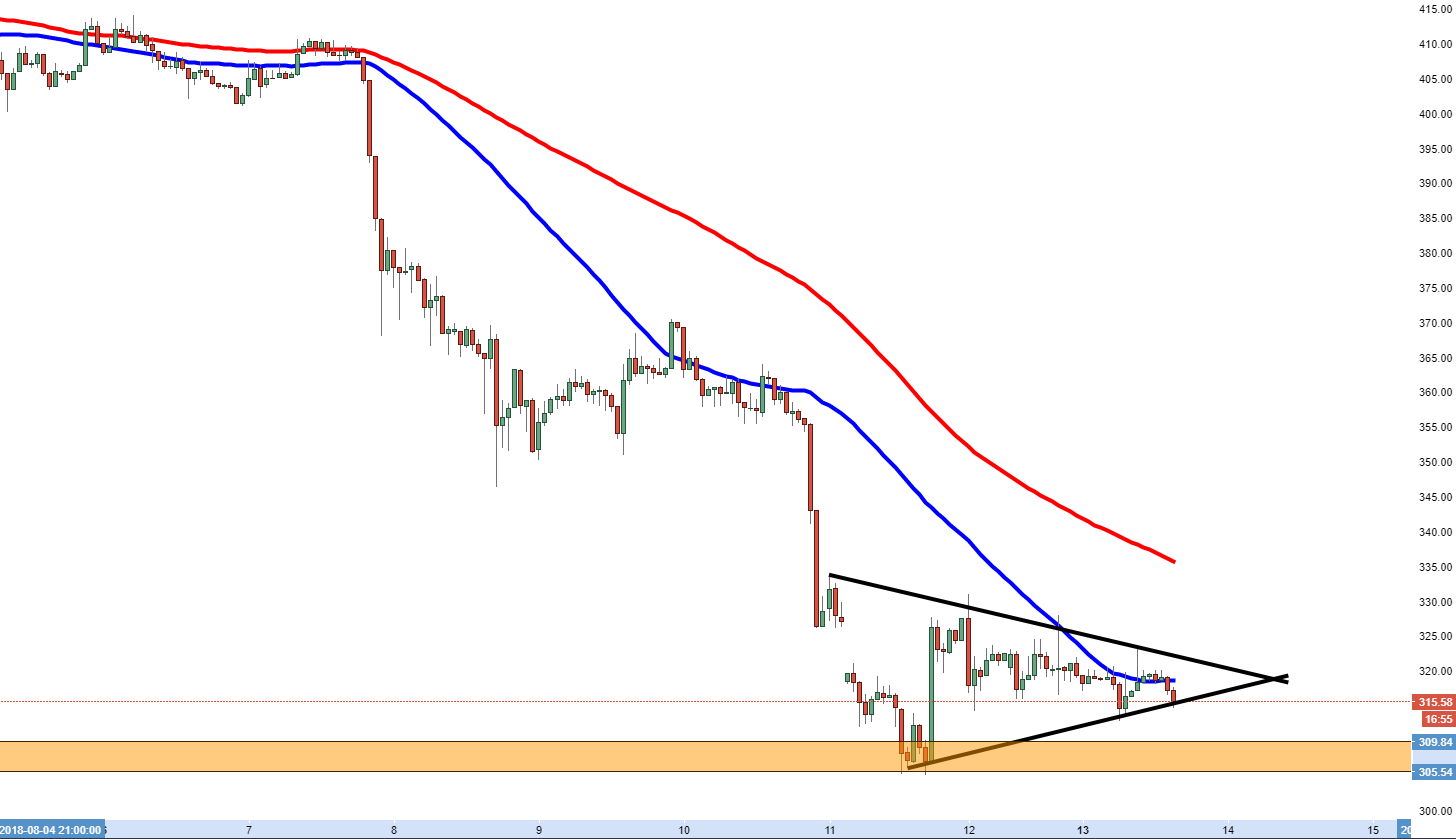
Spot rate: 315.17
Relative change: -0.87%
High: 323.55
Low: 312.78
Trend: Bearish.
Support 1: 315.00, lower part of pennant.
Support 2: 312.85, (support on 60-minute chart).
Support 3: 310.00, demand zone.
Resistance 1: 318.60, 50MA.
Resistance 2: 321.90, upper part of pennant.
Resistance 3: 335.10, 100MA.
