Home Ethereum Technical Analysis: ETH/USD price action narrows within early $500 territory, eyes on bearish flag formation
Crypto News

Ethereum Technical Analysis: ETH/USD price action narrows within early $500 territory, eyes on bearish flag formation

  • Ethereum remains on the back foot during trading through Tuesday’s session, down 1.30%.
  • A bearish flag formation can be eyed on the 15-minute chart view.
  • ETH/USD price has been trading within a tight $30 range, over the past two sessions.


ETH/USD 15-minute chart
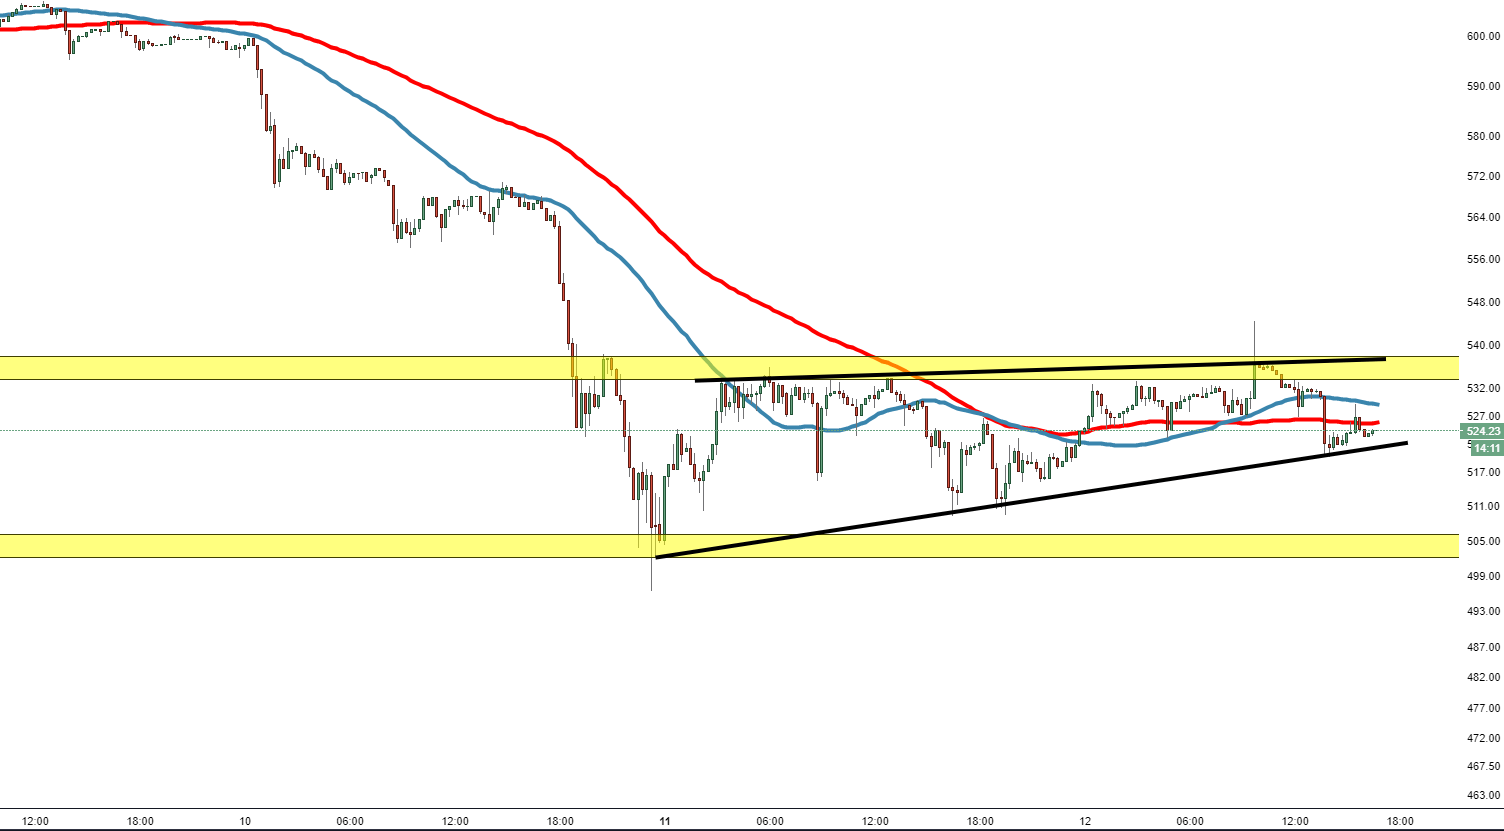
 

Spot rate:                                     523.71

Relative change:               – 1.33%

High:                                                     544.25

Low:                                                       519.54


Trend:                                                   Bearish


Support 1:                                  520.00, lower trend line of flag.

Support 2:                                    509.30, (support on 15-minute chart)

Support 3:                                    505, demand zone entry.  

Resistance 1:                           525.60, 100MA.

Resistance 2:                           529.05, 50MA.

Resistance 3:                           533.50, entry supply zone.


FX Street

FX Street

FXStreet is the leading independent portal dedicated to the Foreign Exchange (Forex) market. It was launched in 2000 and the portal has always been proud of their unyielding commitment to provide objective and unbiased information, to enable their users to take better and more confident decisions.