ETH/USD daily chart
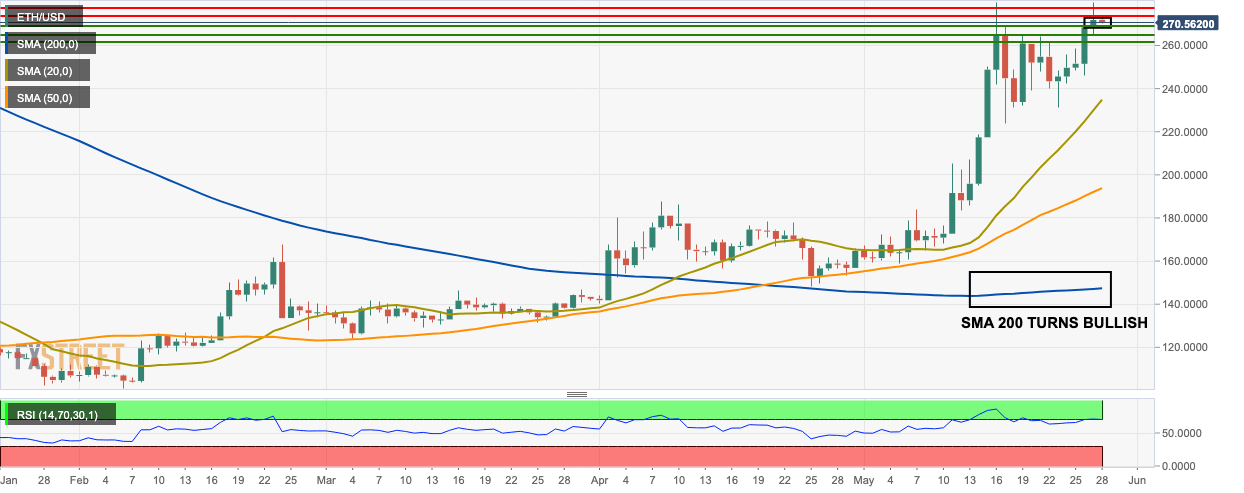
- The bears have control over the market this Tuesday as the price is consolidating between $270-$271.
- The 200-day simple moving average (SMA 200) has turned bullish, which is a great sign for holders.
- The price is trending above the SMA 200, SMA 50, and SMA 20 curves.
- The nearest support level lies at $269 and the closest resistance level lies at $274.25.
- The relative strength index (RSI) indicator is inside the overbought zone, trending around 70.25.
ETH/USD 4-hour chart
-636946019180786396.png)
- The 4-hour market supported by the red and green cloud of the Ichimoku indicator.
- The future sentiment of the market, as per the Ichimoku indicator, is bullish.
- The eight latest sessions of the 4-hour price chart are trending horizontally.
- Two out of the three latest sessions in the Elliot oscillator are bearish.
ETH/USD hourly chart
-636946018819995988.png)
- The hourly ETH/USD market found support on the upward trending line.
- The second last session went above the upper curve of the 20-day Bollinger band and the bears immediately corrected that in the latest session.
- The SMA 20 curve has flat-lined and is acting as immediate support for the market.
- The signal line is looking to crossover with the moving average convergence/divergence (MACD) line indicating decreasing bearish momentum.
Key levels
