Home Ethereum Technical  Analysis: ETH/USD readying to test big line of support within rising channel
Crypto News

Ethereum Technical  Analysis: ETH/USD readying to test big line of support within rising channel

  • Ethereum price was nursing some losses of around 2.5% in the session on Monday.1
  • ETH/USD price action is moving within an ascending channel pattern.  
  • Momentum is currently weighted to the downside, eyes on another test of the lower part of the channel.


ETH/USD 60-minute chart  
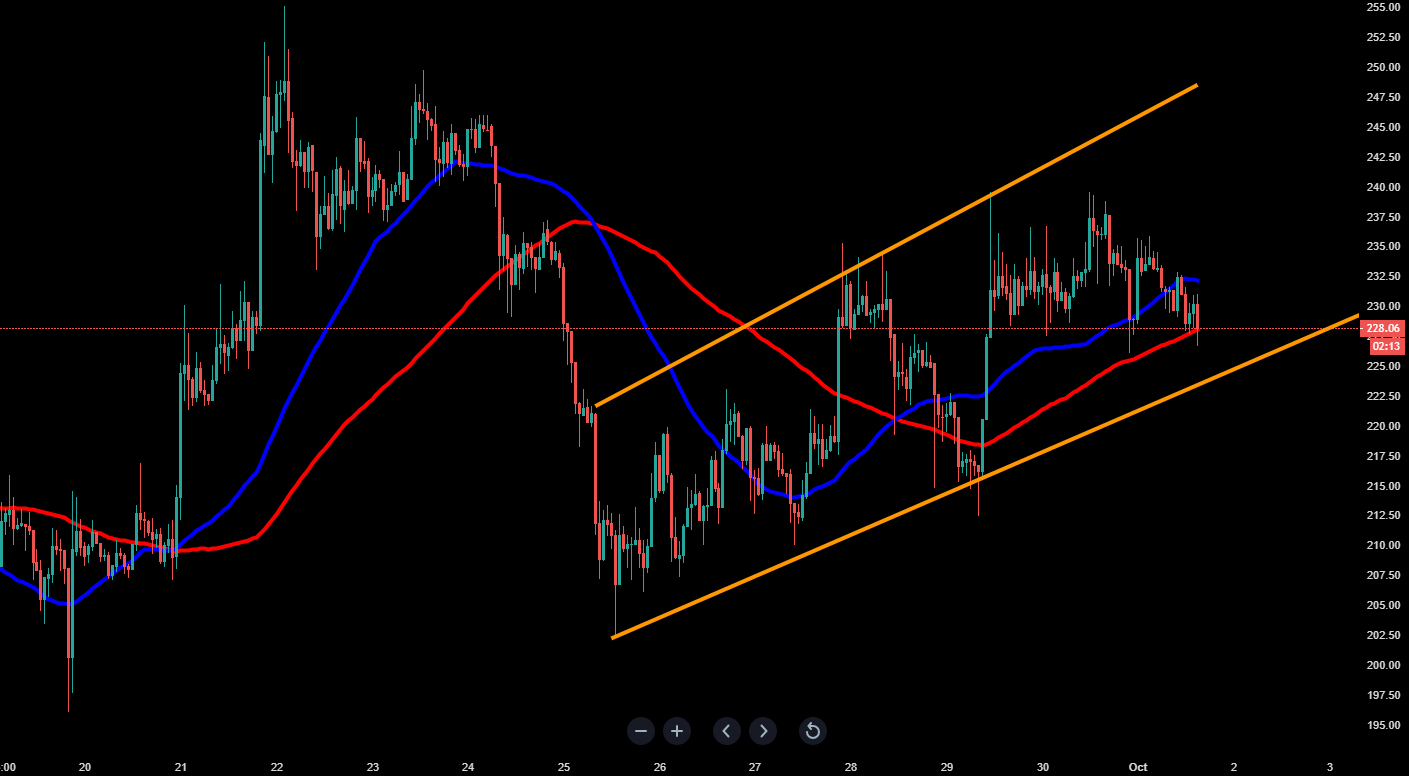


Spot rate:                   227.63

Relative change:       -2.45%

High:                          235.75

Low:                           226.56


Trend:                         Bearish


Support 1:                  223.65, lower part of ascending channel.  

Support 2:                  212.00, demand zone & 29th September low.  

Support 3:                  205.00, support on 60-minute chart.  

Resistance  1:             228.18, 100MA (60-minute).  

Resistance  2:             232.00, very choppy region of resistance & 50MA (60-minute).  

Resistance  3:             239.40, supply area,  


FX Street

FX Street

FXStreet is the leading independent portal dedicated to the Foreign Exchange (Forex) market. It was launched in 2000 and the portal has always been proud of their unyielding commitment to provide objective and unbiased information, to enable their users to take better and more confident decisions.