- ETH/USD erases yesterday’s recovery gains as the negative sentiment surrounding the cryptocurrency market weighs.
- The RSI indicator on the daily chart eases below 40 to suggest that the bears preserve their strength.
- $400 remains as the next short-term target ahead of $360 (2018 low).
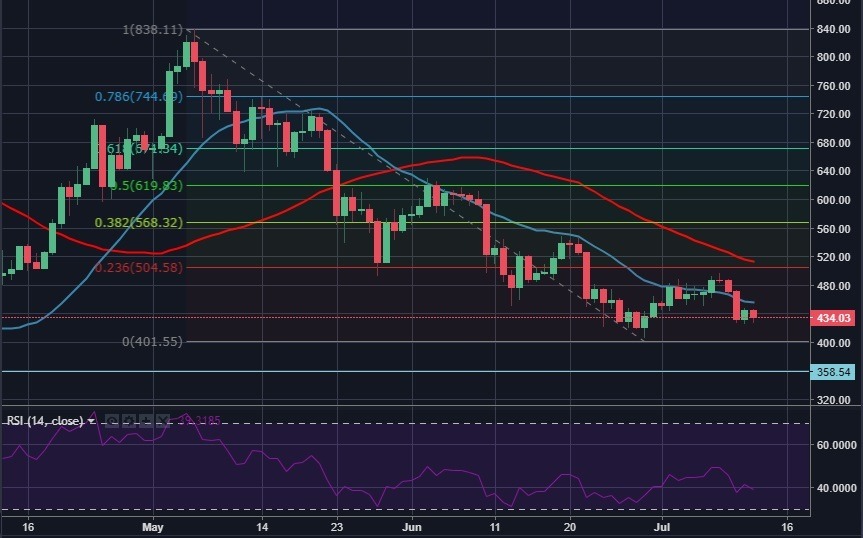
Spot rate: 434.35
Relative change: -2.42%
High: 445.75
Low: 426.46
Trend: Bearish
Support 1: 400 (Jun. 29 low/end point of May 5 – June 29 doıwntrend).
Support 2: 360 (2018 low).
Support 3: 300 (psychological level/horizontal support from Nov. 2017).
Resistance 1: 455 (20-DMA).
Resistance 2: 500/505 (psychological level/Fibo. 23.6% retracement of May 5 – June 29 downtrend).
Resistance 3: 570 (Fibo. 38.2% retracement of May 5 – June 29 downtrend).
