- Ethereum price on Wednesday seen trading in the green by some 0.30%.
- ETH/USD remains subject to downside risks, given bearish pattern structures.
ETH/USD 15-minute chart
- Supply zone eyed within the early $120 price area, a near-term barrier for the bulls.
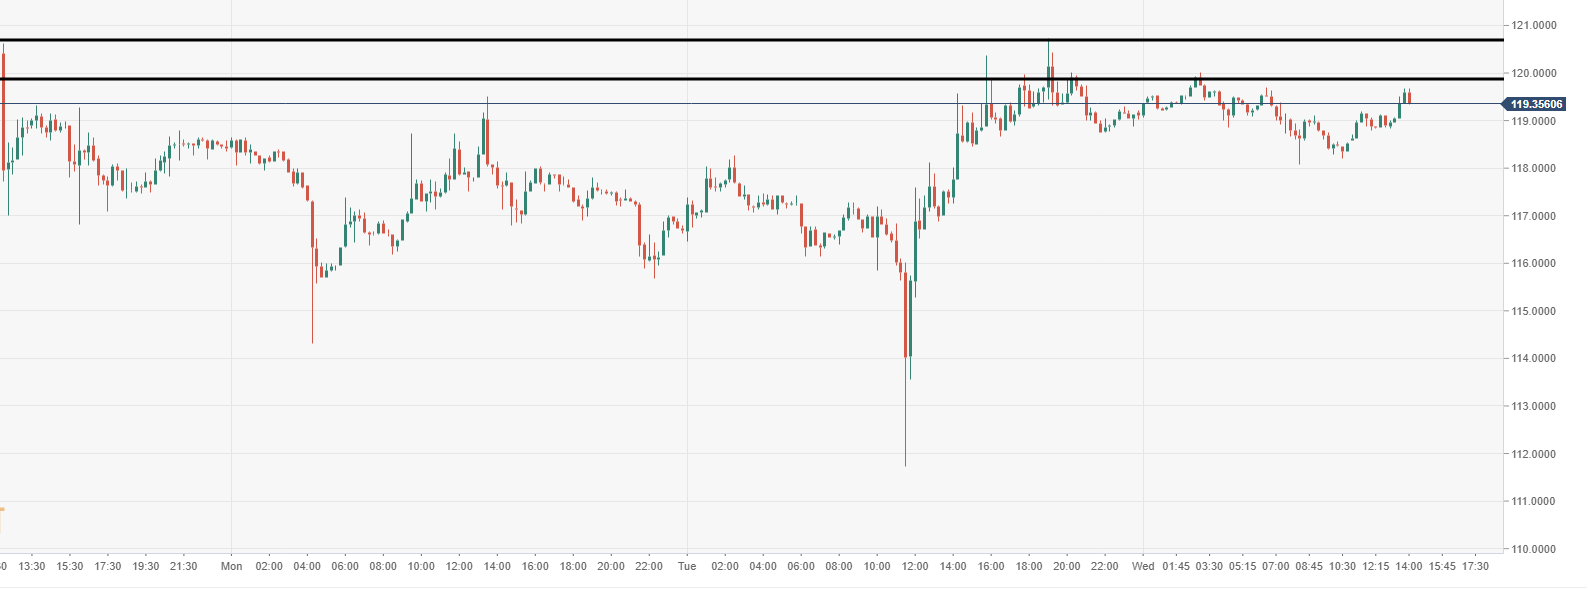
Spot rate: 119.31
Relative change: +0.35%
High: 120.00
Low: 118.07
Trend: Neutral
Support 1: 113.65, daily pivot point support.
Support 2: 108.20, daily pivot point support.
Support 3: 104.66, daily pivot point support.
Resistance 1: 122.64, daily pivot point resistance.
Resistance 2: 126.18, daily pivot point resistance.
Resistance 3: 131.63, daily pivot point resistance.
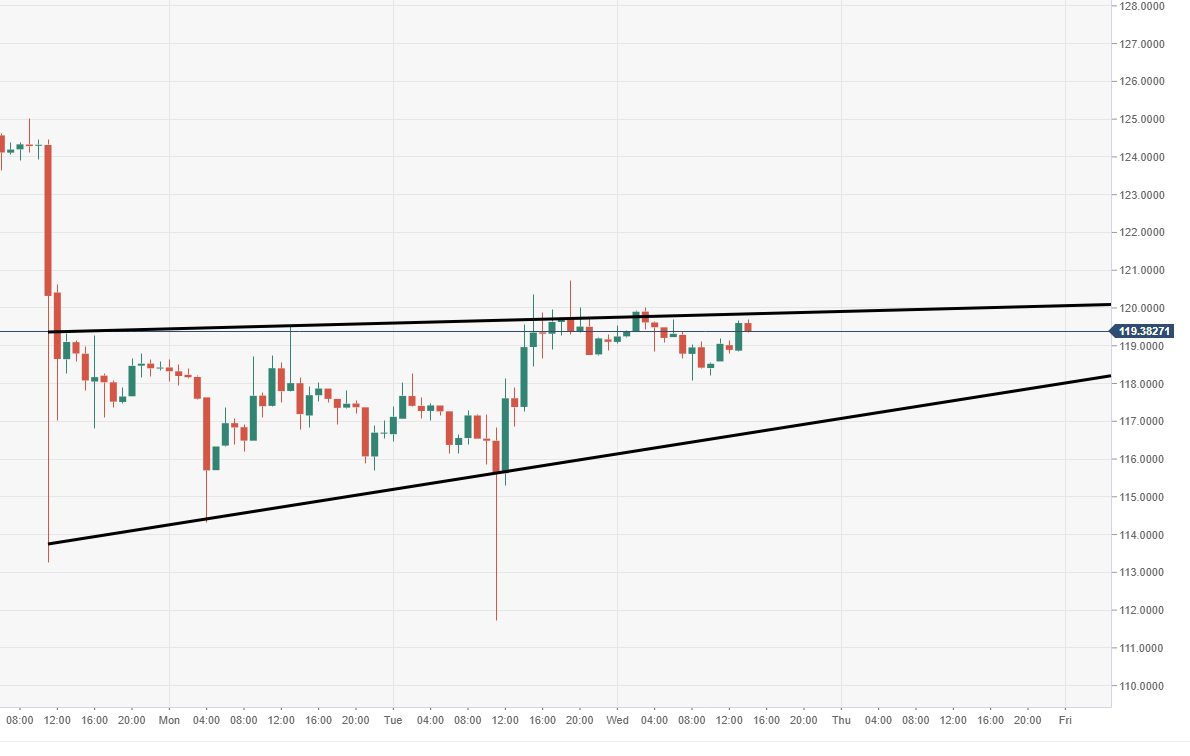
ETH/USD 60-minute chart
- Near-term bearish flag pattern eyed via the 60-minute view.
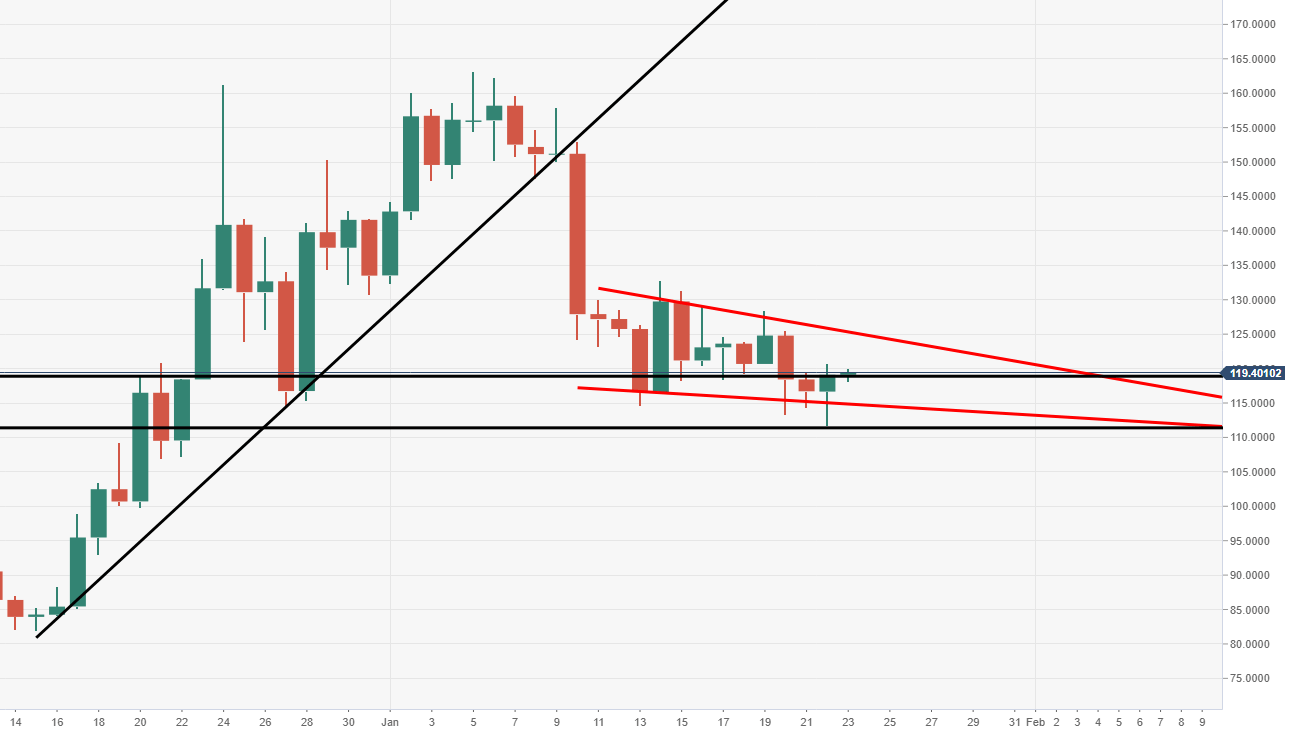
ETH/USD daily chart
- Price remains stuck within narrowing range structure, no sign of a breakout as of yet.