- ETH/USD is currently trading at $392 and eying up the $400 resistance level.
- The daily chart is still a bull flag awaiting confirmation from the buyers.
Ethereum price is currently hovering $392 as bulls are getting ready for the next leg up. The trading volume has been decreasing in the past few days and many indicators have been able to cool off.
ETH/USD daily chart
The daily chart is still a bull flag awaiting another leg up while the RSI has cooled off notably. The 12-EMA has been a strong support level for Ethereum which has bounced several times from it.
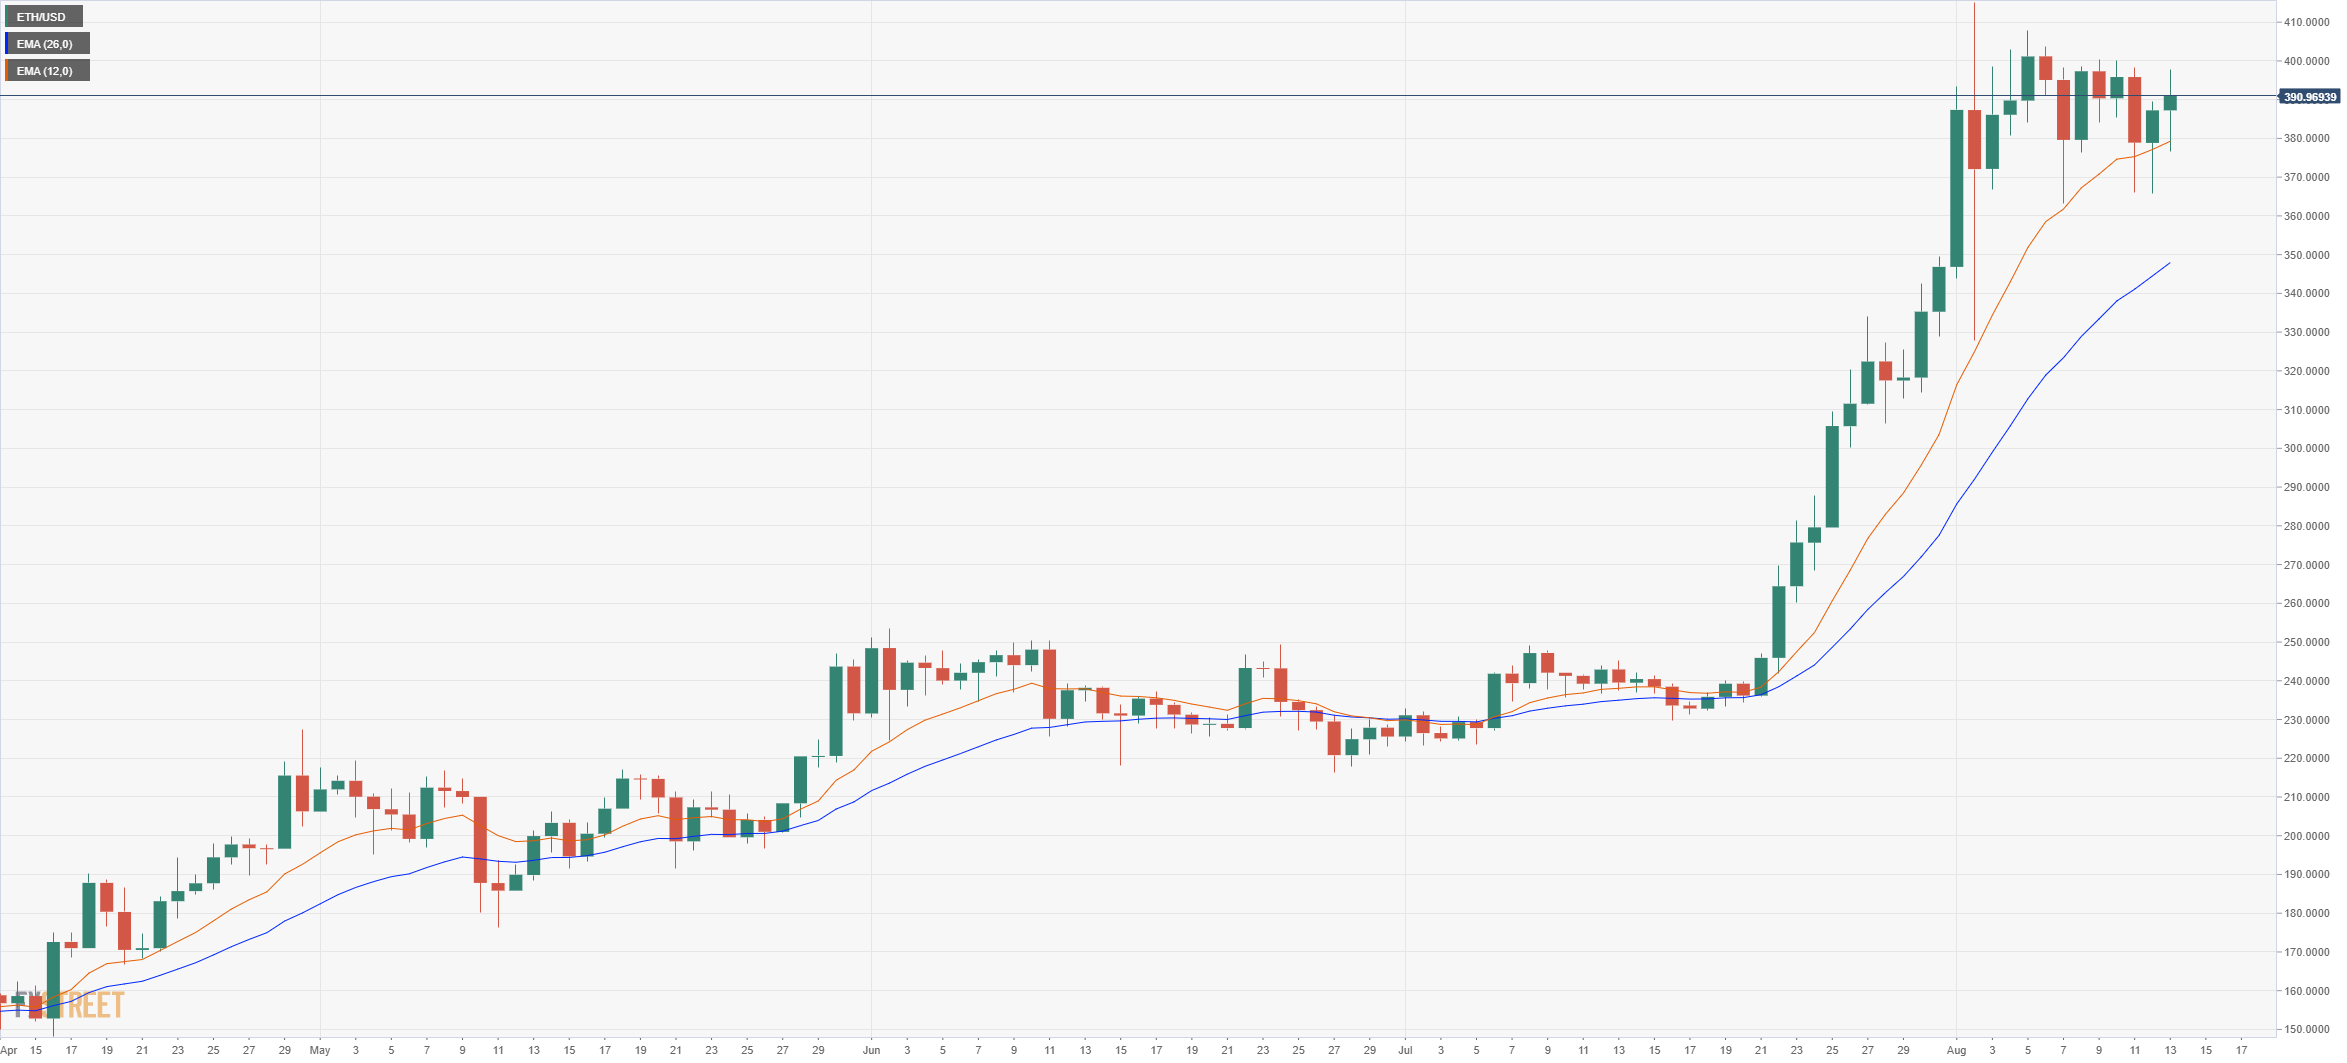
ETH/USD 4-hour chart
-637329366227850329.png)
Ethereum is clearly trading sideways and has lost the EMA’s a few times but it’s now trading above both again. The only real resistance level is located at $400, a breakout above this level will take Ethereum towards $415 and most likely close to $450 thanks to the bullish momentum.
